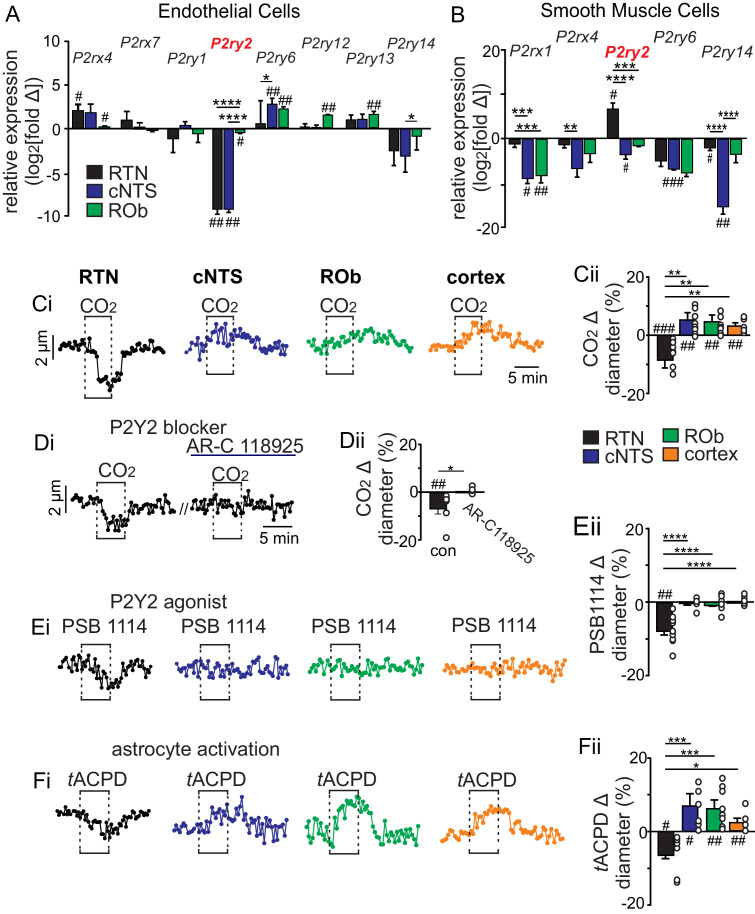
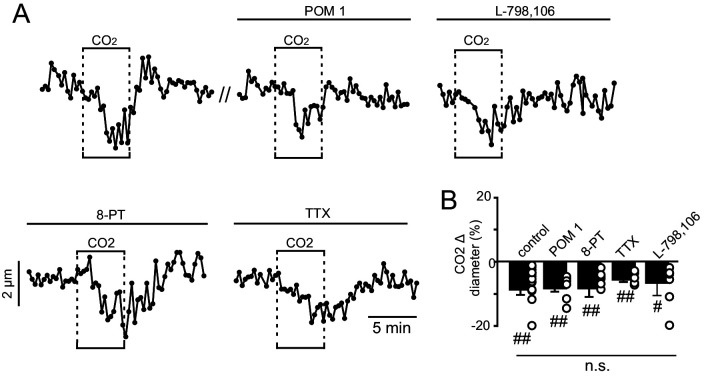
Figure 1. CO2/H+ differentially regulates arteriole tone in the RTN by a P2Y2 receptor dependent mechanism.
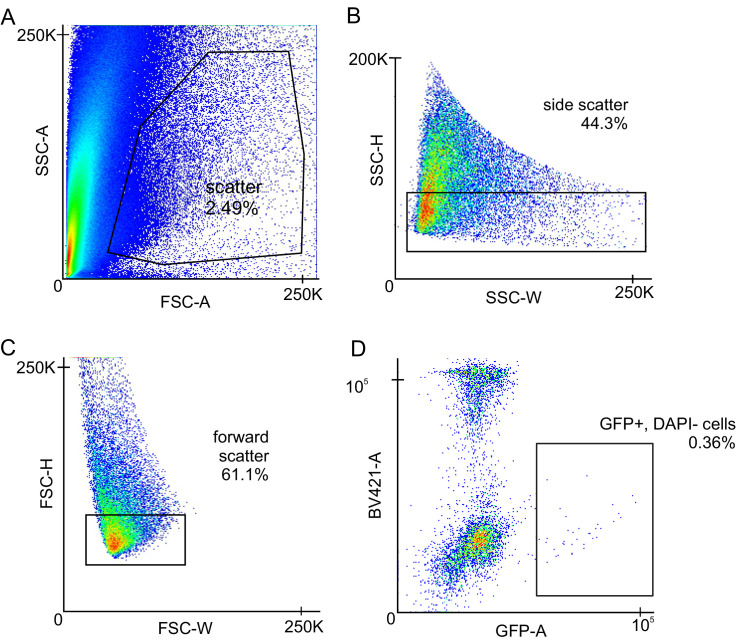
(A-B) Tissue sections containing the cNTS, ROb, and RTN were prepared from an endothelial cell (TekCre::TdTomato) and smooth muscle cell reporter mice (Myh11Cre/eGFP). Individual cells were dissociated and sorted to isolate enriched cell populations from each region (100–300 cells/region). Control cells for each region were prepared from slices with experimental regions removed. Fold change of each P2 receptor was determined for each region by normalizing to within group Gapdh expression as well as to control group receptor expression and plotted as log2[fold change]; 0 on the y-axis indicates control group expression for each receptor and negative values reflect less than the control group and positive values reflect greater than control group. Of all P2 receptors detected in each region, only P2ry2 showed an expression pattern consistent with a role in vasoconstriction in the RTN; low expression in endothelial cells (A) and above baseline expression in smooth muscle cells (B) from this region. (C-F) Diameter of arterioles in the RTN, cNTS, ROb and somatosenstory cortex was monitored in brain slices from adult mice over time by fluorescent video microscopy. (C-F) Diameter traces of individual arterioles in each region and corresponding summary bar graphs show that exposure to 15% CO2 (Ci-ii), activation of P2Y2 receptors by bath application of PSB1114 (100 µM) (Ei-ii), or activation of astrocytes by bath application of t-ACPD (50 μM) (Fi-ii) caused vasoconstriction in the RTN and dilation in all other regions of interest. (Di-Dii) The CO2/H+ response of RTN vessels was blocked by a selective P2Y2 receptor antagonist (AR-C118925; 10 μM) #, difference from baseline (one sample t-test). *, differences in each condition (one-way ANOVA with Tukey’s multiple comparison test). One symbol = p < 0.05, two symbols = p < 0.01, three symbols = p < 0.001, four symbols = p < 0.0001.


