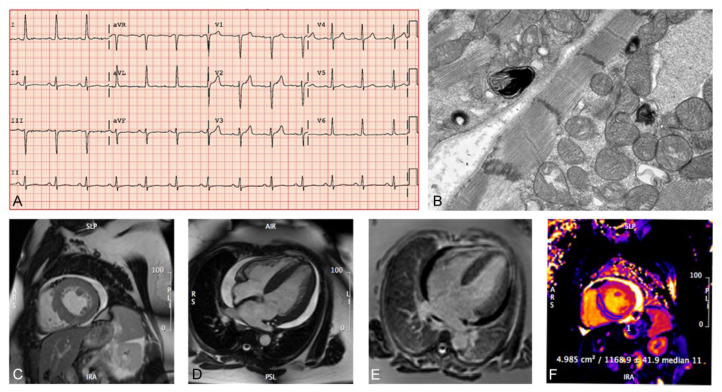
Fig 2. Phenotypic characterization of the patient with hypertrophic cardiomyopathy due to hydroxychloroquine-induced phenocopy.
(A) Twelve-lead electrocardiogram showing elevated R wave in aVL and S wave in V3 consistent with LVH. (B) Endomyocardial biopsy and electron microscopy showing myeloid structures consistent with Fabry disease and other lysosomal storage diseases (magnification 10,000 x). (C-F) Cardiac magnetic resonance imaging showing bi-ventricular concentric hypertrophy, a moderate circumferential pericardial effusion, no convincing scar on LGE imaging and increased native myocardial T relaxation time (FD is characterized by decreased T1 time). LVH indicates Left Ventricular Hypertrophy.

