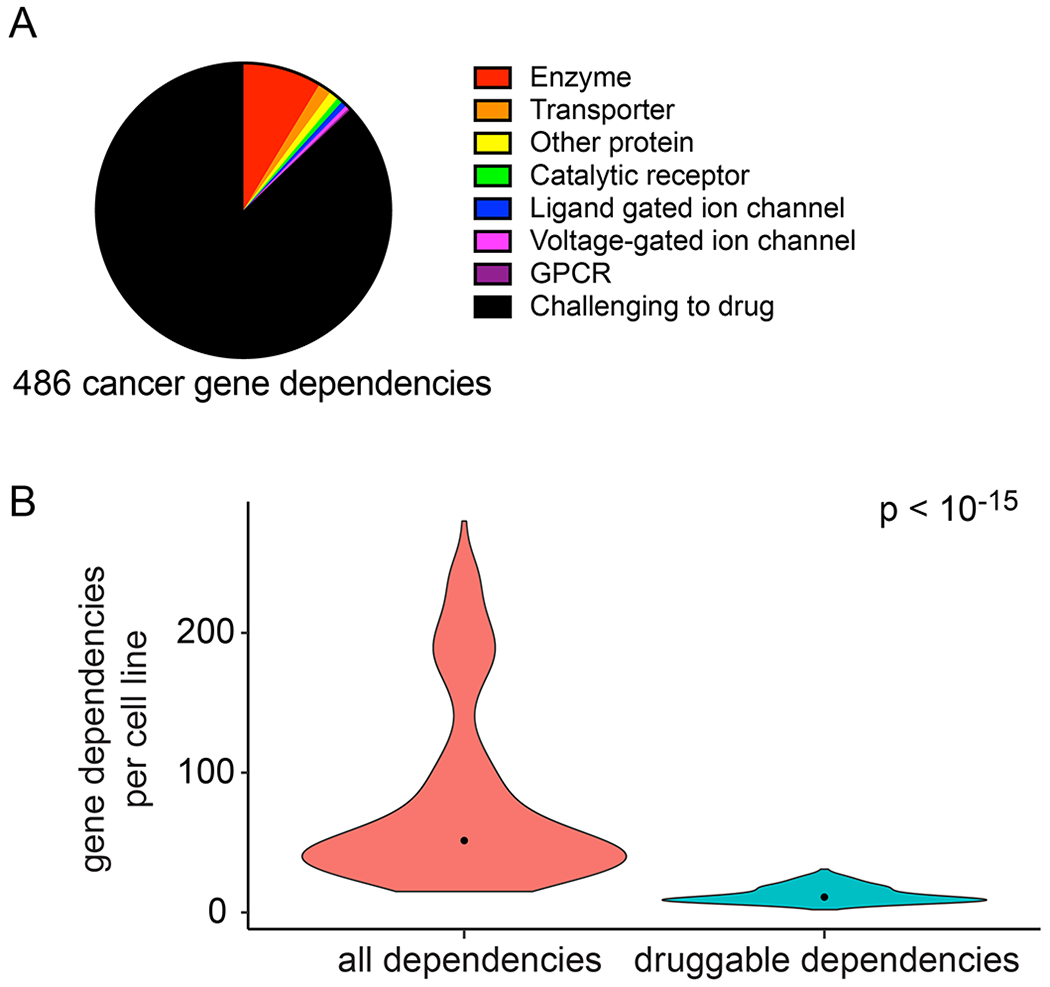
Figure 7.

Cancer gene dependency targets. (A) Pie chart indicating the IUPHAR target classification for the 486 cancer gene dependencies identified. (B) Violin plot quantifying the number of potent gene dependencies per cell line. Candidate gene dependencies that belonged to an existing IUPHAR target class were considered “draggable”. Width of plots represents relative sample density, dots represent sample median. A t-test was used for comparing the gene dependencies in the two groups, which indicated that the number of druggable dependencies is significantly different (p<10−15).
