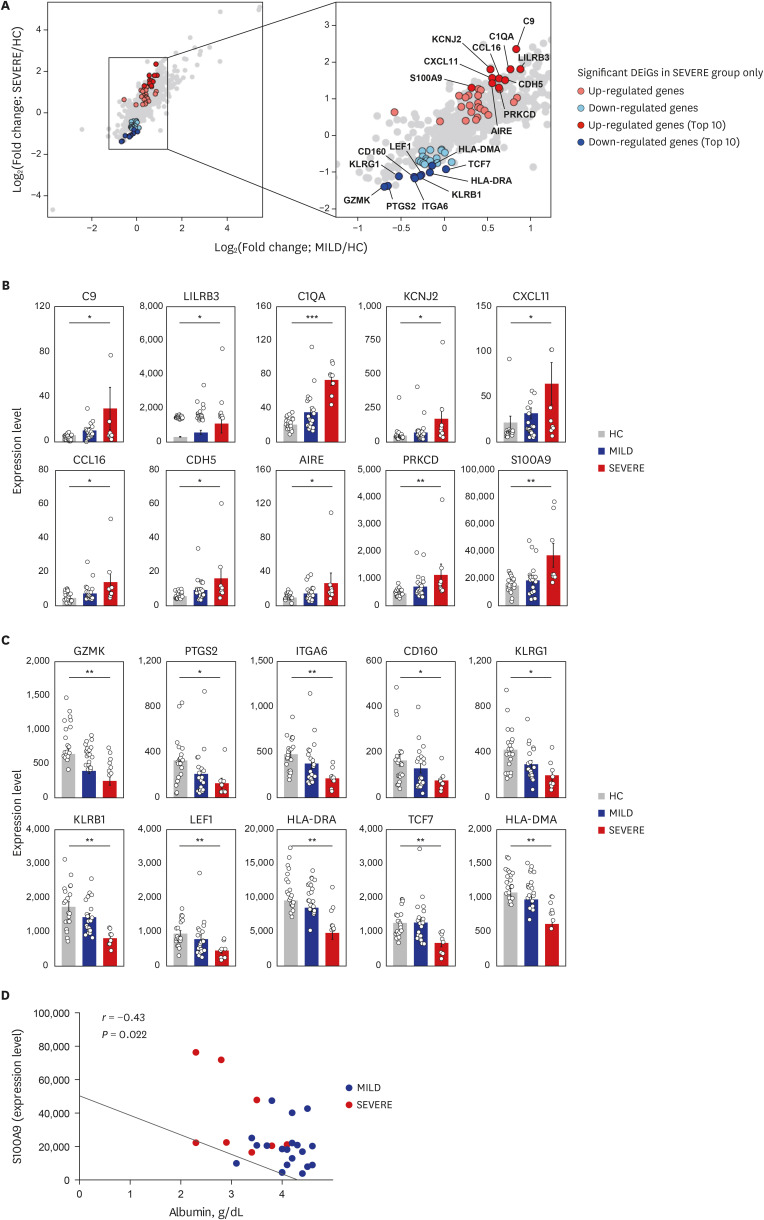
Fig. 3. Top 10 most significantly up- and down-regulated DEiGs in SEVERE patients. (A) Log2-transformed fold changes of 579 immune-genes from MILD vs. HC (x-axis) and SEVERE vs. HC (y-axis). The genes for red and blue colors indicate up- and down-regulated DEiGs in SEVERE patients, respectively. (B, C) Comparisons of expression levels of top 10 up- (B) and down- (C) regulated DEiGs. The expression level was represented by FPKM. (D) Correlation analysis between S100A9 expression level and serum albumin in MILD and SEVERE patients. Error bar indicates standard error of mean. P values were calculated using Mann-Whitney U test and adjusted P values (FDR) were shown (B, C) and Spearman's correlation is shown (D).
DEiG = differentially expressed immune gene, MILD = mild/moderate, SEVERE = severe/critical, HC = healthy controls, FPKM = fragments per kilobase exon-model per million reads mapped, FDR = false discovery rate, CCL = C-C motif chemokine ligand, CXCL = C-X-C motif chemokine ligand.
*P < 0.05; **P < 0.01; ***P < 0.001.

