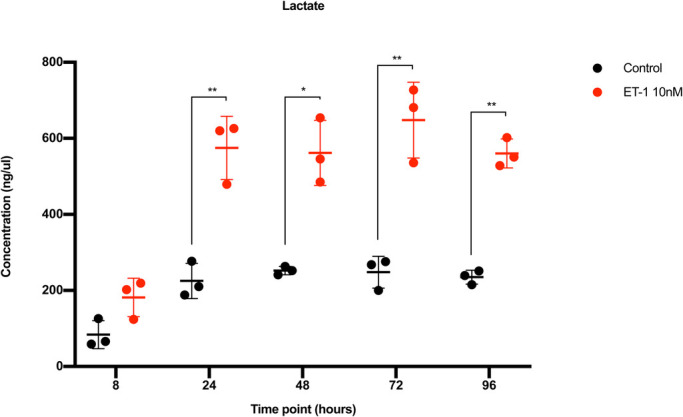
Fig. 5.

Lactate concentration analysis in conditioned media. The x-axis shows the time points and the y-axis the concentration of lactate in ng/µl. Red dots represent CMs stimulated with ET-1 and black dots represent control CMs. s.d. is given as error bars (n=3). *P<0.05, **P<0.01.
