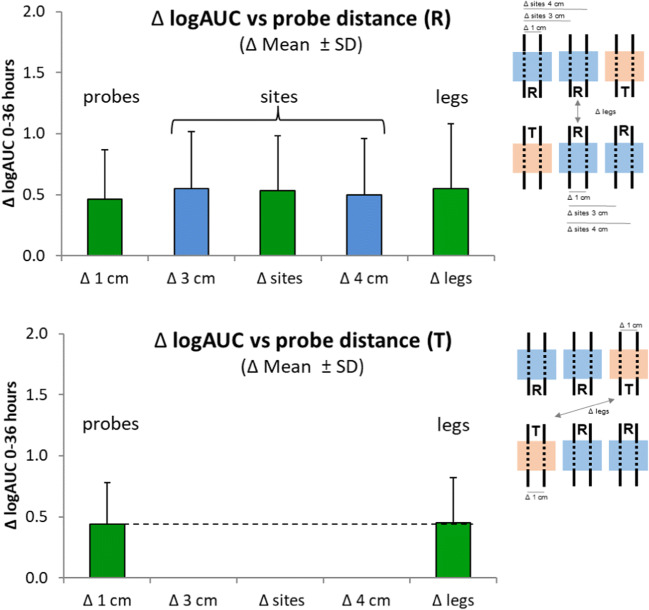
Fig. 6.
Mean differences of logAUC values between two probes depending on their positions and their distances relative to each other. Upper panel: logAUC values for R for adjacent probes in the same treatment site (Δ 1 cm) differed by logAUC 0.46 corresponding to an arithmetic mean difference of 59%. The difference between the logAUC values increased only slightly when the two probes were in two different treatment sites (Δ 3 cm and Δ 4 cm) or at different legs (Δ leg). Lower panel: logAUC values for T between adjacent probes differed by logAUC 0.44 corresponding to an arithmetic mean difference of 55%. The factor leg did not add any variation

