Figure 1.
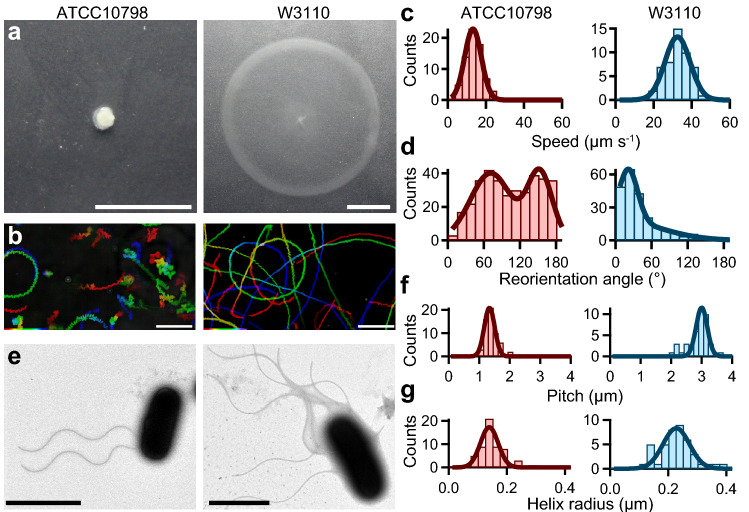
Characterization of swimming motility and structural parameters of ATCC10798 and W3110. (a) Motility of E. coli ATCC10798 and W3110 cells on 0.25% (wt/vol) soft-agar plates incubated at 30 °C for 7 h. Scale bar, 1 cm. (b) Sequential phase-contrast images taken at 50 ms intervals for 10 s were integrated using an intermittent color code: “red → yellow → green → cyan → blue.” Scale bar, 20 μm. (c) Histograms of the swimming speed of ATCC10798 (left) and W3110 (right). Solid lines represent the Gaussian fitting; the peaks (± SDs) are at 13.2 ± 4.4 μm s−1 in ATCC10798 (n = 70) and at 32.5 ± 6.6 μm s−1 in W3110 (n = 50). (d) Histogram of reorientation angles during swimming. The peaks (± SDs) are at 70 ± 31 degrees and 151 ± 23 degrees in ATCC10798 (n = 354) and at 34 ± 13 degrees in W3110 (n = 119). (e) Electron micrographs of E. coli ATCC10798 (left) and W3110 (right) cells. Scale bars, 2 μm. (f) Histograms of the flagellar pitch. Solid lines represent the Gaussian fitting, the peaks (± SDs) are at 1.3 ± 0.2 μm for ATCC10798 (n = 59) and at 3.0 ± 0.2 μm for W3110 (n = 41). (g) Histograms of the helix radius. The peaks (± SDs) are at 0.14 ± 0.03 μm in ATCC10798 (n = 59) and at 0.23 ± 0.05 μm in W3110 (n = 42).

