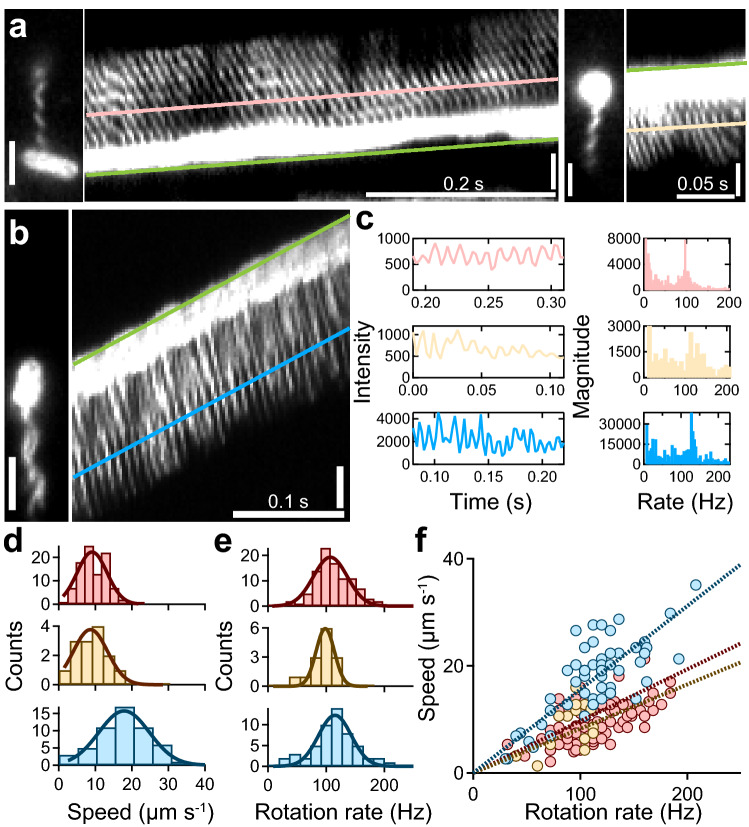
Figure 2.
Visualization of forward and backward movements in ATCC10798. (a) Micrographs and kymographs of ATCC10798 cells during backward (left) and forward swimming (right). The green line drawn at the tip of the cell enabled quantification of the swimming speed of the cells. The pink and beige lines were drawn on the signal of flagella, where the slopes were the same as those of the green lines. Scale bar, 2 μm. (b) Typical example of a swimming run of W3110 cells. The green line drawn at the tip of the cell enabled quantification of the swimming speed of the cells. The blue line was drawn on the signal of flagella, where the slope was the same as that of the green line. Scale bar, 2 μm. (c) Left: intensity changes along flagellar filaments, colors correspond to those in (a) and (b). Right: frequency analysis was done by a Fourier transform. The peaks for backward and forward swimming of ATCC10798, and for the run of W3110 were at 94, 108, and 124 Hz, respectively. (d) Speed histograms of backward (top) and forward (middle) swimming of ATCC10798 cells, and of the swimming run of W3110 cells (bottom). The solid lines represent the Gaussian fitting, where the peaks (± SDs) are at 9.1 ± 4.1 μm s−1 for backward swimming (n = 96), at 8.7 ± 4.7 μm s−1 for forward swimming (n = 14), and at 17.9 ± 6.9 μm s−1 for the W3110 cell run (n = 54). (e) Flagellar rotation rate histograms show that the peaks (± SDs) are at 107.2 ± 29.1 Hz during backward swimming (top) and at 98.4 ± 15.7 Hz during forward swimming (middle) for ATCC10798 cells, and at 115.1 ± 28.1 Hz for W3110 cells (bottom). (f) Relationship between swimming speed and rotation rate. Colors correspond to those in (d) and (e). Dashed lines represent linear fitting with slopes of 0.083 μm per revolution during backward swimming and 0.097 μm per revolution during forward swimming for ATCC10798 cells, and 0.156 μm per revolution during swimming run for W3110 cells.

