Figure 4.
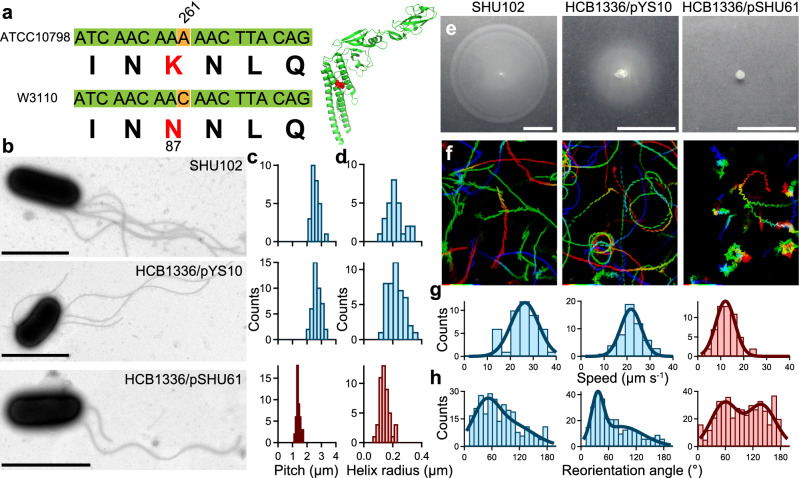
The FliC (N87K) substitution alters flagellar shape and swimming mode. (a) Left: fliC gene and protein sequence comparison. Right: Crystal structure of FliC (PDB: 1IO1). The red structure represents N87 residue. (b) Electron micrographs of SHU102 [fliC (N87K):: fliC,], HCB1336/pYS10, and HCB1336/pSHU61. Scale bars, 2 μm. (c) Histograms of the flagellar pitch observed in SHU102 (top), HCB1336/pYS10 (middle), and HCB1336/pSHU61 (bottom) cells with peaks (± SDs) at 2.5 ± 0.2 μm (n = 27), 2.7 ± 0.3 μm (n = 42), and 1.4 ± 0.1 μm (n = 46), respectively. (d) Histogram of the helix radius observed in SHU102 (top), HCB1336/pYS10 (middle), and HCB1336/pSHU61 (bottom) cells with peaks (± SDs) at 0.20 ± 0.04 μm (n = 27), 0.22 ± 0.06 μm (n = 44), and 0.14 ± 0.03 μm (n = 46), respectively. (e) Cell motility on 0.25% (wt/vol) soft-agar plates after 7 h at 30 ºC. Scale bar, 1 cm. (f) Swimming traces at 150 ms intervals for 15 s. The intermittent color code indicates the time course from red to blue. Area, 68.6 × 85.9 μm. (g) Swimming speed histograms of SHU102 (left), HCB1336/pYS10 (middle), and HCB1336/pSHU61 (right) cells with peaks (± SD) at 26.3 ± 6.0 μm s−1 (n = 45), 21.7 ± 4.5 μm s−1 (n = 53), and 12.0 ± 4.2 μm s−1 (n = 53), respectively. (h) Reorientation angle histograms with peaks (± SDs) at 46 ± 28 degrees in SHU102 cells (left, n = 269), at 36 ± 13 degrees in HCB1336/pYS10 cells (middle, n = 285), and at 58 ± 29 degrees and 139 ± 30 degrees in HCB1336/pSHU61 cells (right, n = 444).

