Abstract
Lung cancer has the highest mortality rate of all cancers, and early detection can improve survival rates. In the recent years, low-dose CT has been widely used to detect lung cancer. However, the diagnosis is limited by the subjective experience of doctors. Therefore, the main purpose of this study is to use convolutional neural network to realize the benign and malignant classification of pulmonary nodules in CT images. We collected 1004 cases of pulmonary nodules from LIDC-IDRI dataset, among which 554 cases were benign and 450 cases were malignant. According to the doctors’ annotates on the center coordinates of the nodules, two 3D CT image patches of pulmonary nodules with different scales were extracted. In this study, our work focuses on two aspects. Firstly, we constructed a multi-stream multi-task network (MSMT), which combined multi-scale feature with multi-attribute classification for the first time, and applied it to the classification of benign and malignant pulmonary nodules. Secondly, we proposed a new loss function to balance the relationship between different attributes. The final experimental results showed that our model was effective compared with the same type of study. The area under ROC curve, accuracy, sensitivity, and specificity were 0.979, 93.92%, 92.60%, and 96.25%, respectively.
Keywords: Convolutional neural network, Pulmonary nodule classification, Multi-scale feature fusion, Multi-task learning
Introduction
Lung cancer has the highest mortality rate among all cancer diseases in the world and poses a great threat to human health. Statistics showed that the number of new cases and deaths of lung cancer in 2018 ranked first, accounting for 11.8% of total new cases of cancer and 18.4% of total deaths of cancer, respectively [1]. In most cases, it is difficult to detect lung cancer at an early stage, and it is too late to treat patients once their initial symptoms begin. However, according to the American Cancer Society, if lung cancer is detected early, the survival rate can reach 47% [2]. Therefore, early and accurate interpretation of nodules is of great significance for the prevention and treatment of lung cancer.
In recent years, low-dose CT imaging technology has become increasingly mature, has been widely used in clinical examinations, and also has great advantages in the screening of pulmonary nodules [3]. Pulmonary nodules are round, opaque local parenchymal lesions with a diameter less than 3–4 cm [4]. In clinical practice, doctors need to interpret hundreds of CT scan slices according to the radiological characteristics of nodules [5]. However, the diagnosis is limited by the subjective experience of the doctor, the degree of fatigue, and misreading. Therefore, doctors need reliable computer-aided diagnosis (CAD) systems to help them interpret the CT slices. Relevant studies show that a reliable CAD system can help doctors make correct judgments and can effectively improve efficiency and reduce costs [6]. In the CAD system, there are two main methods for automatic classification of pulmonary nodules at present, one is the traditional method, and the other is the classification method using convolutional neural network (CNN) and deep learning.
In the recent years, in order to realize the computer-aided diagnosis of pulmonary nodules, many researchers have explored various pattern recognition methods to discover the morphological and imaging features related to the diagnosis, including original features such as the texture [7], shape [7–9], and gray-scale [7] of pulmonary nodules. It also includes advanced features extracted from original features, such as Wang et al. [10] uses based on local binary pattern (LBP) texture feature and shape feature of the radial gradient histogram (HOG) to characterize nodules and Farag et al. [11] using texture and shape features extracted by LBP, Gabor, and LBP fusion feature descriptors to classify pulmonary nodules. However, for traditional pattern recognition methods, feature extraction is not easy and lacks of computer self-learning ability. Radiologists need to do a lot of research work to discover many features related to diagnosis.
With the research and development of deep learning, CNN has become an effective alternative to traditional pattern recognition methods. CNN can automatically extract features from the input image and output results on the output end, which is an end-to-end working manner. Due to the good performance of CNN in the field of natural image analysis, some researchers have explored the application of CNN in the analysis of medical image.
According to the research on deep learning based on automatic diagnosis of pulmonary nodules, we have got three inspirations. Firstly, the spatial information of 3D images is helpful to improve the classification accuracy. For example, Nibali et al. [12] established a 2.5D CNN, which uses three perpendicular 2D images as input and used three identical residual networks to extract features from three different views. Polat et al. [13] built a 3D CNN, which can effectively learn the spatial information of images and achieve a good classification effect. For 3D spatial images, the classification accuracy of 3D CNN is usually higher than that of 2D CNN [14, 15]. Secondly, by using images of multiple sizes, the network can pay attention to the overall and detailed information of the target and make accurate judgments. Liu et al. [16] built a multi-scale CNN, which uses image patches of multiple sizes as input, combines context information at different scales, and successfully applies classification with nodules. Dou et al. [15] also designed a multi-stream multi-scale CNN to combine the context information of multi-scale images to realize the diagnosis and classification of pulmonary nodules. The method of combining contextual information of different scale images has been proved to be effective in computer vision tasks [17]. Thirdly, by learning the subtle features between different attributes, the classification effect of the network will be better. Li et al. [18] built a multi-task learning CNN model, combining the eight attributes’ grading of nodules with the benign and malignant classification, effectively improving the evaluation indicators. Multi-task learning improves network performance by learning multiple objectives from a shared representations and mining the internal relationship between multiple objectives [19]. However, the classification performance of multi-task learning networks depends on the weight selection between the loss of each task.
Based on the above findings, this paper proposes a new CNN pulmonary nodule classification model, which combines multi-scale image features with multi-attribute grading tasks. This network combines a multi-stream CNN structure, a residual network structure, and a multi-task learning network structure, so we call it a multi-stream and multi-task (MSMT) network. Our research contributions can be summarized as follows:
Combining the multi-scale features of pulmonary nodules with multi-attribute classification is proposed in relevant studies for the first time.
A loss function for multi-task learning is constructed, which can regulate the loss relationship between different tasks.
In the LIDC-IDRI dataset, the overall performance of our model is more competitive than the methods proposed in relevant references.
Materials and Method
Data Acquisition and Preprocessing
To evaluate our method, we used the LIDC-IDRI dataset from the Lung Image Database Association [20], which is one of the largest publicly available lung cancer screening datasets. The dataset collected 1018 clinical lung CT scans from 7 institutions, and each CT scan contained a relevant XML file containing the independent diagnostic results of four experienced radiologists. The diagnostic results include the coordinates of the pulmonary nodules larger than 3 mm in diameter, the degree of malignancy, and the quantitative scores of eight attributes, Table 1 shows radiologists’ grading rules for malignancy degree and attributes. In addition, the American College of Radiology recommends that thin-layer CT scans should be used for nodule classification [21]. Therefore, we removed scans where the slice thickness is greater than 3 mm, missing slices, and inconsistent slices spacing. At the same time, nodules less than 3 mm are considered to be clinically irrelevant [22]. Therefore, we only retain nodules with a diameter greater than or equal to 3 mm, and at least three of the four radiologists have made such a diagnosis. Therefore, we only reserved CT scans with nodule diameters greater than or equal to 3 mm, and at least three of the four radiologists made such a diagnosis.
Table 1.
Grading rules for malignancy degree and attributes
| Malignancy | ① Highly unlikely | ② Moderately unlikely | ③ Indeterminate |
| ④ Moderately | ⑤ Highly suspicious | ||
| Subtlety | ① Extremely subtle | ② Moderately subtle | ③ Fairly subtle |
| ④ Moderately obvious | ⑤ Obvious | ||
| Internal Structure | ① Soft tissue | ② Fluid | ③ Fat |
| ④ Air | |||
| Calcification | ① Popcorn | ② Laminated | ③ Solid |
| ④ Non-central | ⑤ Central | ⑥ Absent | |
| Sphericity | ① Linear | ③ Ovoid | ⑤ Round |
| Margin | ① Poorly defined | ⑤ Sharp | |
| Lobulation | ① None | ⑤ Marked | |
| Spiculation | ① None | ⑤ Marked | |
| Texture | ① Non-solid | ③ Part solid | ⑤ Solid |
Because these nodules lack the results of histopathology, we characterize pulmonary nodules based on the doctor’s score. First of all, we need to divide the dataset into benign and malignant according to the score of malignancy degree, with score ranging from 1 to 5. Since each nodule is independently diagnosed by four radiologists, different scores may be generated, so we define the average score of malignancy given by the four radiologists as the overall degree of malignancy. Specifically, we consider that nodules with an average score above 3 to be malignant nodules, while nodules with an average score below 3 are benign nodules. Nodules with an average score of 3 were removed to explain the indecisiveness of the radiologists. In a similar way, we calculate the average score of each attribute as a final level after rounding. We eventually obtained a total of 1004 cases of pulmonary nodules, including 554 benign cases and 450 malignant cases. Since the images collected in the dataset were generated by different CT scanners and the spatial resolution was slightly different, we used third-order spline interpolation to regulate the size of all voxels to 1 × 1 × 1 mm3.
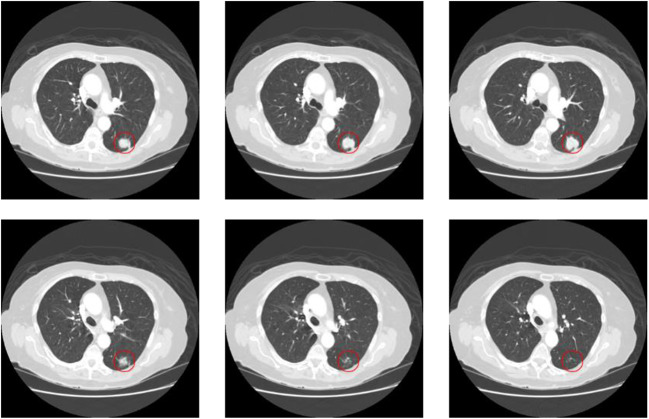
A typical CT scan consists of hundreds of gray-scale images with a size of 512 × 512. However, because of the small size of pulmonary nodules, it is unrealistic to classify pulmonary nodules by processing the whole image. Therefore, we need to extract the pulmonary nodule areas based on the nodule center coordinate marked by the doctor in the XML file. In this study, we extracted 3D patches of nodules at two different scales. According to the statistics of nodule diameter distribution in Table 2, in order to extract the characteristics of nodules more accurately, we limited the volume of the first patch to 32 × 32 × 6 mm3, in which the pulmonary nodules occupy the main position. We limited the volume of the second patch to 64 × 64 × 12 mm3, covering the entire nodule and surrounding tissues. And we adjust the size of the second patch to 32 × 32 × 6 mm3, and the image patches of the two scales are denoted as S1 and S2, respectively. Figure 1 shows the morphology of the same nodule in different CT scan slices.
Table 2.
The statistics of nodule diameter distribution
| Size (mm) | ≤ 10 | (10, 20] | (20, 32] | > 32 |
|---|---|---|---|---|
| Benign | 539 | 15 | 0 | 0 |
| Malignant | 201 | 202 | 46 | 1 |
Fig. 1.
The morphology of the same nodule in 6 consecutive CT scan slices. The area marked by the red circle is the pulmonary nodule
Method
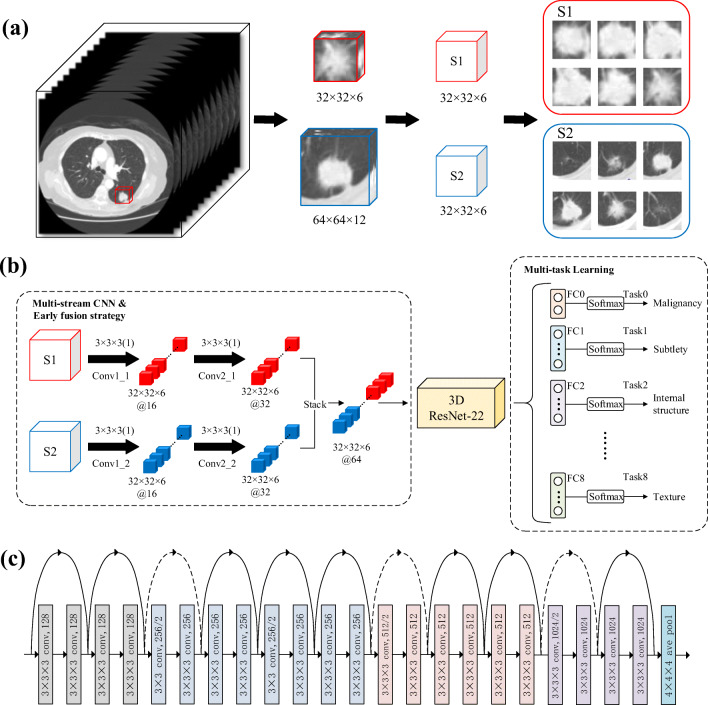
In this section, we describe a new CNN model, in which the features of two different scale image patches are fused by multi-stream CNN, and the benign and malignant classification and attribute classification of pulmonary nodules are realized by multi-task learning. Figure 2 shows the new CNN model, which consists of three parts: (1) Two 3D image patches (S1 and S2) with different scales are used as the input of the model, and the initial feature extraction is realized by the multi-stream CNN, and then the features are fused by the early fusion strategy; (2) input the fused 3D feature maps into the fine-tuned 3D residual network (ResNet-22) to extract the deep features; (3) by combining the classification of benign and malignant with the attributes classification of pulmonary nodules through multi-task learning, the model can output the classification of benign and malignant and the classification of eight attributes at the same time. In addition, in order to balance the relationship between different tasks, we propose a new multi-task learning loss function.
Fig. 2.
Overview of the proposed model structure. a Extraction process of two 3D image patches (S1 and S2) at different scales. b The overall structure of MSMT network includes three parts: multi-stream CNN, 3D resnet-22, and multi-task classification network (FC0 is used for benign and malignant classification, FC1-FC8 is used for attribute classification). c Fine-tuned 3D ResNet-22 network structure
Multi-stream CNN
Since the multi-stream CNN can focus on the context information of the candidate nodules in different scale images, the features extracted from the different streams can complement each other. Therefore, it is best to learn the features of different scale images simultaneously through a network model so that the network can extract more effective features. For this reason, we designed a two-stream CNN with two convolution layers to extract the features of image patches (S1 and S2) that were cut by two different sizes and stacked the features map respectively extracted from the two streams through early fusion strategy to form a new feature map.
Residual Network Structure
The traditional CNN model increases the network depth by stacking convolutional layers to improve the classification accuracy. But the problem with stacking too many convolution layers is that the gradient disappears. If the network depth is simply increased without any supplement, the training accuracy will be reduced during learning, and the model will not converge to the global minimum value. The residual network (ResNet) proposed by He et al. [23] effectively solved this problem.
In contrast to the normal network in Fig. 3a , ResNet is composed of one basic residual block after another. As shown in Fig. 3b, each residual block is stacked by two convolution layers. ResNet attempts to learn local and global features by combining skip connections at different levels so as to overcome the problem that different levels of features cannot be integrated in ordinary networks [24]. Figure 2 shows our fine adjustment ResNet structure, which is stacked with 11 basic residual blocks.
Fig. 3.
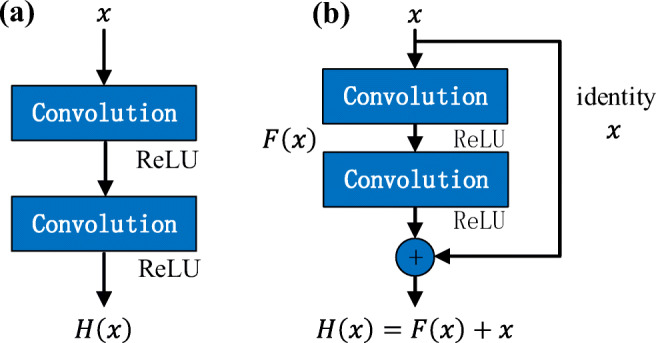
Building blocks for normal network and residual network. a Normal CNN building block. b Residual network building block for ResNet-22
Multi-task Learning
The diagnosis of pulmonary nodules by radiologists usually depends on the characteristics of different attributes, so there is a strong correlation between benign and malignant classification and attributes classification. Our study takes note of this and combines benign and malignant classification with attributes classification of pulmonary nodules through multi-task learning. The advantage of multi-task learning is that the network can find the internal relationship between different tasks in an end-to-end manner. As shown in Fig. 2b , the multi-task learning network includes 9 fully connected layers. The first fully connected layer FC0 is used to distinguish the benign and malignant pulmonary nodules. The remaining eight fully connected layers FCT (T∈1,2,⋯,8) correspond to the eight attributes classification, respectively. In order to adjust the relationship between different tasks, we construct a new multi-task loss function based on the cross-entropy loss function [25].
The fully connected layer FC0 is connected to two output nodes. We record these two nodes as oi (i ∈ 1, 2), which represent benign and malignant prediction results, respectively. We choose the Softmax function to normalize the prediction results, so the prediction probability of the nodes corresponding to benign and malignant can be expressed as follows:
| 1 |
The cross-entropy loss function for benign and malignant classification tasks can be expressed as:
| 2 |
where p(i) is the predicted probability of node oi obtained by formula (1), q(i) is the true probability value of the node, if the corresponding result of this node is true, and q(i) is equal to 1; otherwise, q(i) is equal to 0. The smaller the value of the loss function L0, the closer the prediction probability p(i) is to the true probability.
For the remaining eight attribute classification tasks, the corresponding classification rules have been given in Table 1. We assume that each attribute has k levels, so the corresponding fully connected layer FCT has k output nodes, and we record them as oTj (j ∈ 1, ⋯, k), which represent the prediction results corresponding to different levels, respectively. We also use the Softmax function to normalize the prediction results, so the prediction probability of the corresponding node in the attribute classification can be expressed as follows:
| 3 |
The cross-entropy loss function for attribute classification tasks can be expressed as:
| 4 |
Since the MSMT network needs to implement 9 classification tasks at the same time, simply adding the loss function of each task cannot highlight the benign and malignant classification tasks that we are more concerned about. In this study, we set the threshold value of loss function L0 to 1 and set a hyperparameter λ to adjust the relationship between benign and malignant classification task and attribute classification tasks. The value of λ ranges from 0 to 1. Therefore, the final multi-task loss function can be defined as follows:
| 5 |
where L0 is the loss function of benign and malignant classification tasks, LT is the loss function of attribute classification tasks, and M is the mini-batch size.
Experiment and Result
Experimental Setting
The implementation of our network is based on Pytorch [26] as a backend, and the Pytorch is a deep learning framework based on Python. Our research was carried out on a workstation with a Linux operating system. The main hardware of the workstation consists of two Intel Xeon E5-2620V4 CPUs working at 2.1 GHz, four 32 G RAMs, and four NVIDIA GTX 1080 8 GB GPUs.
We evaluated this method in the LIDC dataset using CT scan image patches of 1004 pulmonary nodules that contained 450 malignant nodules and 554 benign nodules. We choose stratified 10-fold cross-validation as a rigorous validation model [27]. All data are randomly divided into 10 subsets. Nine of these subsets were used for training and one for testing, which was repeated ten times. In the training stage, we used stochastic gradient descent (SGD) to optimize the model. We initialize the parameters according to our experience. The momentum of SGD is 0.9, the initial learning rate is 0.0001, the weight attenuation is 1 × 10⁻⁴, and the mini-batch size is 16. Our experiments had carried out a total of 300 epochs.
Validation of Hyperparameter
In this paper, we need to modify the network parameters repeatedly by using the method of stochastic gradient descent and finally make the result of the loss function reach the minimum value. According to the multi-task loss function given by formula (6), it can be seen that both classification and classification of tasks have an impact on the results of the loss function. And λ is a hyperparameter that regulates the relationship between the losses of two different types of tasks. According to the description in “Experimental Setting”, ten experiments with 10 different values of λ were conducted to select the best value. We change the λ from 0 to 1 at intervals of 0.1. The final results show that when λ is 0.3, the model can obtain the best classification performance. Figure 4 shows the impact of different λ values on model classification performance.
Fig. 4.
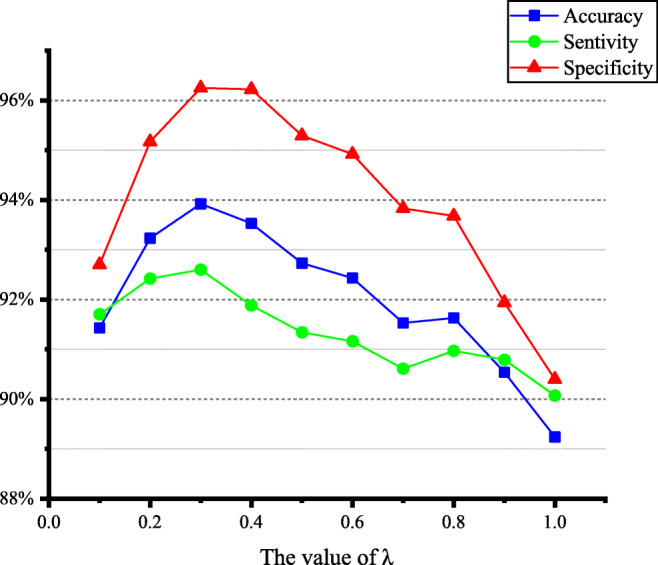
The impact of different λ values on model classification performance
Comparative Experiment
Influence of Different Depths of ResNet on Model Classification Performance
Here, we conducted a series of experiments to find the most appropriate depth of the ResNet. We change the network depth by changing the number of residual block stacks of the ResNet structure in Fig. 2. The ResNet structure with different depths is shown in Table 3. As can be seen from the result in Fig. 5, deepening the depth of the network may not improve the classification effect. This problem may be limited by the size of the number of cases in the dataset and disappearance of gradient. From the results, we can see that ResNet-22 can achieve the best classification performance in our classification model. Therefore, we use ResNet-22 structure to extract deep features in the MSMT network model.
Table 3.
The 3D ResNet architecture in different depths
| Layer | Output size | Building block | The number of building blocks in the residual network | ||||
|---|---|---|---|---|---|---|---|
| ResNet-16 | ResNet-28 | ResNet-34 | ResNet-40 | ResNet-46 | |||
| Conv_3.x | 32 × 32 × 32 | × 2 | × 2 | × 3 | × 3 | × 4 | |
| Conv_4.x | 16 × 16 × 16 | × 2 | × 4 | × 4 | × 6 | × 6 | |
| Conv_5.x | 8 × 8 × 8 | × 2 | × 6 | × 7 | × 8 | × 9 | |
| Cong_6.x | 4 × 4 × 4 | × 2 | × 2 | × 3 | × 3 | × 4 | |
Fig. 5.
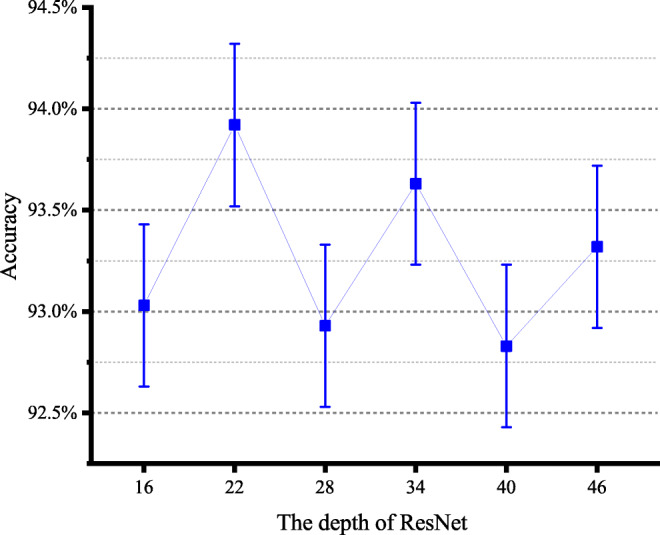
The accuracy of 3D ResNet in different depths
The Influence of Multi-scale Fusion and Feature Fusion Strategies on Model Classification Performance
In order to evaluate the influence of multi-scale fusion and different feature fusion strategies on model classification performance, we designed three comparative experiments. In the first two experiments, image patches S1 and S2 were used as the input of single-stream and single-scale CNN, respectively. In the third experiment, we choose the mid-term fusion strategy used by Kamnitsas et al. [28] to evaluate the impact of feature fusion strategy on classification performance. In this section, we compared the mid-term fusion strategy with the early fusion strategy used by the MSMT network model. Figure 6 describes the network structure of the mid-term fusion strategy applied in this experiment. The early fusion strategy stacks the feature maps generated by the last convolutional layer of each stream to form a new combined feature map. Each stream of the mid-term fusion strategy generates a 1024 d feature vector and then uses a fully connected layer containing 1024 nodes to linearly superpose the feature vectors generated by each stream to form a new 1024 d feature vector.
Fig. 7.
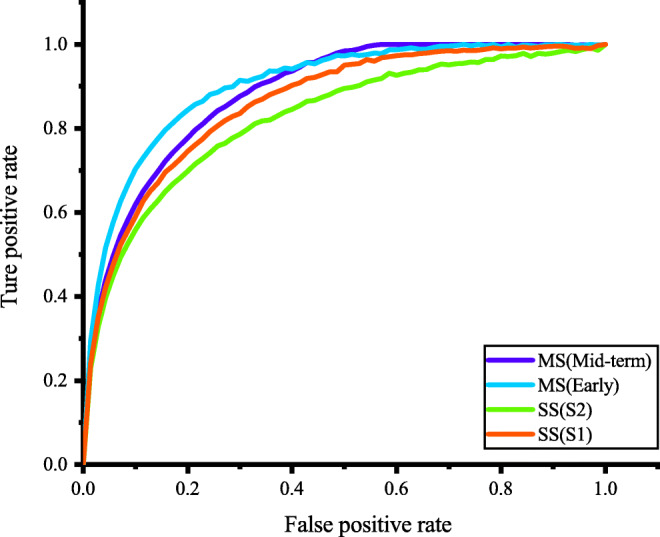
Receiver operating characteristic (ROC) curve. SS represents single scale image, and MS represents multi-scale image patch fusion
Fig. 6.
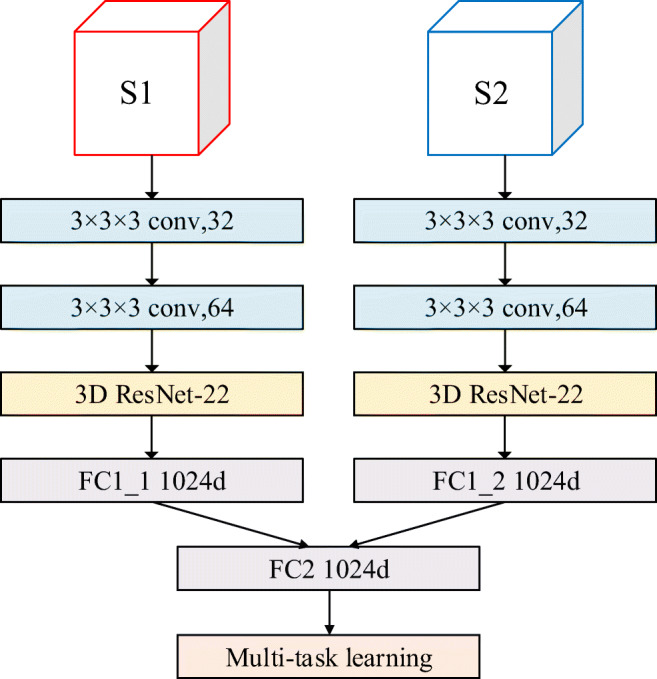
The architecture of mid-term fusion strategy
Table 4 summarizes the final experimental results. Compared with single-scale CNN, multi-scale fusion CNN has significantly improvement classification performance. At the same time, the mid-term fusion strategy can improve the classification performance by comparing the feature vectors of different scales and using Softmax as classifier. However, the mid-term fusion strategy ignores the pixel correspondence between different acceptance domain relationships. The early fusion strategy we use can be regarded as a learning-based fusion strategy. Each single-scale CNN stacks the feature maps after two convolution layers. The new feature map is then imported into the ResNet-22 to extract deep features. Therefore, we can effectively improve the classification performance of the model by fusing the features of multi-scale images with early fusion strategy (Fig. 8).
Table 4.
The effect of multi-scale fusion and fusion strategy on model classification performance
| Accuracy | Sensitivity | Specificity | |
|---|---|---|---|
| Single scale(S1) | 91.33% | 90.97% | 93.16% |
| Single scale(S2) | 90.74% | 89.71% | 93.25% |
|
Multi-scale (early fusion) |
93.92% | 92.60% | 96.25% |
|
Multi-scale (mid-level fusion) |
92.33% | 91.89% | 94.10% |
Fig. 8.
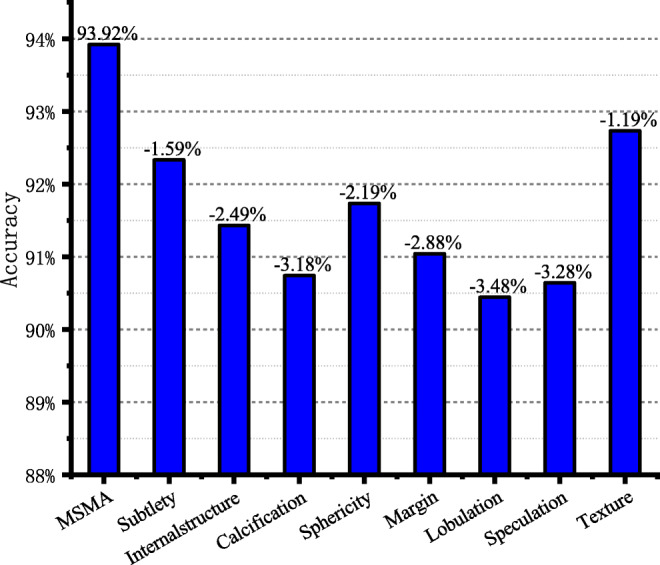
The model classification accuracy corresponding to the attribute deleted from model each time
Impact of Attributes Classification on Benign and Malignant Classification
The MSMT network includes benign and malignant classification of lung nodules and classification of eight attributes. In order to evaluate the impact of different attributes on the accuracy of benign and malignant classification, we establish eight comparative experiments in this section. In eight experiments, we remove an attribute classification task from the multi-task learning network each time and retrain and test the network according to the experimental settings in “Experimental Setting.” The final experimental results are shown in Fig. 8. The first column gives the benign and malignant classification accuracy of the MSMT network model, and the next eight columns give the benign and malignant classification accuracy of the model after removing the corresponding attributes on the coordinate axis. Experimental results showed that removing any attribute will reduce the accuracy of benign and malignant classification of the model.
Discussion
The Advantages of the Proposed Method
In this paper, we proposed a lung nodule classification method that combined the advantages of multi-scale CNN and multi task learning, which was quite different from simply deepening the depth of the network. First, the network uses two 3D image blocks of different scales as input so that the network pays attention to both the local information of the nodules and the surrounding information. Secondly, we obtained an effective feature extraction network by changing the number of residual blocks in the experiment. Finally, the model could discover the internal relationships between different tasks by multi-task learning and effectively accelerate the convergence process of CNN. Our multi-task loss function can balance the relationships between different tasks, highlight the importance of benign and malignant classification, and effectively improve the performance of benign and malignant classification.
Comparison with State of the Art
One of the most important advantages of deep learning is the ability to automatically learn related features from the original image. Table 5 provides a comparison of our method with other deep learning methods, including 2D CNN-based studies [28–30] and 3D CNN-based studies [13, 30].
These studies include multi-scale CNN methods [29], CNN methods combining texture features and shape features (Fused-TSD) [30], and multi-view knowledge-based collaborative (MV-KBC) deep neural network model [31]. They all used the LIDC-IDRI database for experiments. Because the structure of the method proposed by Lyu et al. [29] is relatively simple, and the amount of data used in the experiment is also small, the final accuracy rate is lower than other studies. In addition, it can be seen from Table 4; we can see that compared with 2D CNN, 3D CNN has a significant improvement in classification performance.
Because CT images contain spatial data, 3D CNN can extract spatial information of pulmonary nodules more effectively. Polat et al. [13] proposed a 3D CNN using radial basis function (RBF) as a classifier to realize the benign and malignant classification of pulmonary nodules. Compared with their research, the indicators of our proposed method have improved. Causey et al. [32] constructed a deep 3D CNN model that combined quantitative image features (QIF) to achieve benign and malignant classification of pulmonary nodules. Although their specificity is slightly higher than ours, the accuracy and sensitivity of our method have been improved, and both of which are more concerned by radiologists. In particular, the specificity of our method has been greatly improved compared with these studies.
Table 5.
Comparison results of model classification performance with current research
| Method | Database (number) |
Accuracy (%) |
Sensitivity (%) |
Specificity (%) |
AUC | |
|---|---|---|---|---|---|---|
|
Lyu et al. [29] |
Multi-scale CNN |
LIDC-IDRI (865) |
84.10 | – | – | – |
|
Xie et al. [30] |
Fuse-TSD |
LIDC-IDRI (1990) |
89.53 | 84.19 | 92.02 | 0.9665 |
| Xie et al. [31] | MV-KBC |
LIDC-IDRI (1945) |
91.60 | 86.52 | 94.00 | 0.9570 |
|
Polat et al. [13] |
3D CNN + RBF |
Kaggle (2101) |
91.81 | 88.53 | 94.23 | – |
|
Causey et al. [32] |
3D CNN + QIF |
LIDC-IDRI (664) |
93.20 | 87.90 | 98.50 | 0.9710 |
| Our method | 3D CNN + Multi-Scale + Multi-Task |
LIDC-IDRI (962) |
93.92 | 92.60 | 96.25 | 0.9790 |
Limitations and Future Works
Although the performance of our method has improved compared with the previous research, some problems still need to be solved. Firstly, although 3D CNN can effectively extract the spatial features of pulmonary nodules, it also contains more parameters that need to be learned. Therefore, we hope that in future work, we will expand the existing dataset and enhance the generalization ability of the model by cross-validating between different datasets. Secondly, although the internal relationships between different tasks can be found more effectively through multi-task learning, it is obviously unwise to manually adjust the weight combination of the multi-task loss function. So in future work, we will focus on exploring an effective way of weight self-learning so that the weight can be adjusted automatically in the process of training.
Conclusion
In our research, we proposed a new CNN model for the benign and malignant classification of pulmonary nodules. For the first time, our study combined multi-scale feature fusion and multi-attribute classification to construct a new 3D CNN model and proposed a new loss function to balance the relationships between different tasks in multi-task learning. Firstly, multi-scale feature fusion can make the network pay attention to the information of the tissue around the nodule and effectively improve the generalization ability of the network. Secondly, the grading of different attributes is fused into our classification tasks through multi-task learning so that the network can pay attention to the subtle differences in images and improve the classification performance of the network. Finally, we validated our method on the LIDC-IDRI dataset and obtained good experimental results.
Funding Information
The paper supported by the General Object of National Natural Science Foundation (61772358) Research on the key technology of BDS precision positioning in complex landform; Project supported by International Cooperation Project of Shanxi Province (Grant No.201603D421014) Three-Dimensional Reconstruction Research of Quantitative Multiple Sclerosis Demyelination; International Cooperation Project of Shanxi Province (Grant No. 201603D421012): Research on the key technology of GNSS area strengthen information extraction based on crowd sensing.
Compliance with Ethical Standards
Conflict of Interest
The authors declare that they have no conflict of interest.
Footnotes
Publisher’s Note
Springer Nature remains neutral with regard to jurisdictional claims in published maps and institutional affiliations.
References
- 1.Bray F, Ferlay J, Soerjomataram I, Siegel RL, Torre LA, Jemal A. Global cancer statistics 2018: GLOBOCAN estimates of incidence and mortality worldwide for 36 cancers in 185 countries. CA: A Cancer Journal for Clinicians. 2018;68(6):394–424. doi: 10.3322/caac.21492. [DOI] [PubMed] [Google Scholar]
- 2.Siegel RL, Miller KD, Jemal A. Cancer statistics, 2018. CA: A Cancer Journal for Clinicians. 2018;68(1):7–30. doi: 10.3322/caac.21442. [DOI] [PubMed] [Google Scholar]
- 3.Oudkerk M, Devaraj A, Vliegenthart R, et al. European position statement on lung cancer screening. LANCET ONCOL. 2017;18(12):E754–E766. doi: 10.1016/S1470-2045(17)30861-6. [DOI] [PubMed] [Google Scholar]
- 4.Gould MK, Maclean CC, Kuschner WG, Rydzak CE, Owens DK. Accuracy of positron emission tomography for diagnosis of pulmonary nodules and mass lesions: a meta-analysis. JAMA. 2001;285(7):914–924. doi: 10.1001/jama.285.7.914. [DOI] [PubMed] [Google Scholar]
- 5.Liu Y, Balagurunathan Y, Atwater T. Radiological Image Traits Predictive of Cancer Status in Pulmonary Nodules. CLIN CANCER RES. 2017;23(6):1442–1449. doi: 10.1158/1078-0432.CCR-15-3102. [DOI] [PMC free article] [PubMed] [Google Scholar]
- 6.Zhang G, Yang Z, Gong L. An Appraisal of Nodule Diagnosis for Lung Cancer in CT Images. J MED SYST. 2019;43(7):181. doi: 10.1007/s10916-019-1327-0. [DOI] [PubMed] [Google Scholar]
- 7.Han F, Wang H, Zhang G, et al. Texture Feature Analysis for Computer-Aided Diagnosis on Pulmonary Nodules. J DIGIT IMAGING. 2015;28(1):99–115. doi: 10.1007/s10278-014-9718-8. [DOI] [PMC free article] [PubMed] [Google Scholar]
- 8.Ye X, Lin X, Dehmeshki J, Slabaugh G, Beddoe G: Shape-based computer-aided detection of lung nodules in thoracic CT images. IEEE TRANSACTIONS ON BIOMEDICAL ENGINEERING 56(7): 1810-1820, 2009 [DOI] [PubMed]
- 9.Dhara AK, Mukhopadhyay S, Dutta A, Garg M, Khandelwal N. A Combination of Shape and Texture Features for Classification of Pulmonary Nodules in Lung CT Images. J DIGIT IMAGING. 2016;29(4):466–475. doi: 10.1007/s10278-015-9857-6. [DOI] [PMC free article] [PubMed] [Google Scholar]
- 10.Wang H, Zhao T, Li LC, et al. A hybrid CNN feature model for pulmonary nodule malignancy risk differentiation. J Xray Sci Technol. 2018;26(2):171–187. doi: 10.3233/XST-17302. [DOI] [PubMed] [Google Scholar]
- 11.Farag AA, Ali A, Elshazly S, Farag AA. Feature fusion for lung nodule classification. INTERNATIONAL JOURNAL OF COMPUTER ASSISTED RADIOLOGY AND SURGERY. 1809;12(10):2017. doi: 10.1007/s11548-017-1626-1. [DOI] [PubMed] [Google Scholar]
- 12.Nibali A, He Z, Wollersheim D. Pulmonary nodule classification with deep residual networks. INT J COMPUT ASS RAD. 1799;12(10):2017. doi: 10.1007/s11548-017-1605-6. [DOI] [PubMed] [Google Scholar]
- 13.Polat H, Mehr HD. Classification of Pulmonary CT Images by Using Hybrid 3D-Deep Convolutional Neural Network Architecture. Applied Sciences. 2019;9(5):940. [Google Scholar]
- 14.Huang XJ, Shan JJ, Vaidya V: Lung nodule detection in CT using 3D convolutional neural networks. In: ISBI, 2017, pp 379-383
- 15.Dou Q, Chen H, Yu L, Qin J, Heng PA. Multilevel Contextual 3-D CNNs for False Positive Reduction in Pulmonary Nodule Detection. IEEE transactions on bio-medical engineering. 2017;64(7):1558–1567. doi: 10.1109/TBME.2016.2613502. [DOI] [PubMed] [Google Scholar]
- 16.Liu K, Kang G. Multiview convolutional neural networks for lung nodule classification. INT J IMAG SYST TECH. 2017;27(1):12–22. doi: 10.1371/journal.pone.0188290. [DOI] [PMC free article] [PubMed] [Google Scholar]
- 17.Ciompi F, Chung K, van Riel SJ. Towards automatic pulmonary nodule management in lung cancer screening with deep learning. SCI REP-UK. 2017;7:46479. doi: 10.1038/srep46479. [DOI] [PMC free article] [PubMed] [Google Scholar]
- 18.Li X, Kao Y, Shen W, Li X, Xie G: Lung Nodule Malignancy Prediction Using Multi-task Convolutional Neural Network. In: Medical Imaging 2017: Computer-Aided Diagnosis, vol 10134, 2017, UNSP 1013424. International Society for Optics and Photonics
- 19.Kang B, Zhu WP, Liang D. Robust multi-feature visual tracking via multi-task kernel-based sparse learning. IET IMAGE PROCESS. 2017;11(12):1172–1178. [Google Scholar]
- 20.Armato SG, McLennan G, Bidaut L, McNitt-Gray MF, Meyer CR, Reeves AP, Zhao B, Aberle DR, Henschke CI, Hoffman EA, et al. The Lung Image Database Consortium (LIDC) and Image Database Resource Initiative (IDRI): A Completed Reference Database of Lung Nodules on CT Scans. MED PHYS. 2011;38(2):915–931. doi: 10.1118/1.3528204. [DOI] [PMC free article] [PubMed] [Google Scholar]
- 21.Kazerooni EA, Austin JHM, Black WC, Dyer DS, Hazelton TR, Leung AN, McNitt-Gray MF, Munden RF, Pipavath S. ACR-STR Practice Parameter for the Performance and Reporting of Lung Cancer Screening Thoracic Computed Tomography (CT) JOURNAL OF THORACIC IMAGING JOURNAL OF THORACIC IMAGING. 2014;29(5):310–316. doi: 10.1097/RTI.0000000000000097. [DOI] [PubMed] [Google Scholar]
- 22.Aberle DR, Adams AM, Berg CD, Black WC, Clapp JD, Fagerstrom RM, Gareen IF, Gatsonis C, Marcus PM, Sicks JD. Reduced lung-cancer mortality with low-dose computed tomographic screening. NEW ENGL J MED. 2011;365(5):395–409. doi: 10.1056/NEJMoa1102873. [DOI] [PMC free article] [PubMed] [Google Scholar]
- 23.He K, Zhang X, Ren S, Sun J. Deep residual learning for image recognition. In: Proceedings of the IEEE Conference on Computer Vision and Pattern Recognition, 2016, pp 770–778
- 24.He K, Zhang X, Ren S, Sun J: Identity Mappings in Deep Residual Networks. In: European Conference on Computer Vision. Springer, 2016, pp 630–645
- 25.Kline DM, Berardi VL. Revisiting squared-error and cross-entropy functions for training neural network classifiers. Neural Computing and Applications. 2015;14(4):310–318. [Google Scholar]
- 26.Facebook Inc. Pytorch. Available at https://pytorch.org. Accessed 16 August 2018
- 27.Zhang Y, Yang Z, Lu H, Zhou X, Phillips P, Liu Q, Wang S. Facial Emotion Recognition Based on Biorthogonal Wavelet Entropy, Fuzzy Support Vector Machine, and Stratified Cross Validation. IEEE ACCESS. 2016;4:8375–8385. [Google Scholar]
- 28.Kamnitsas K, Ledig C, Newcombe VFJ, Simpson JP, Kane AD, Menon DK, Rueckert D, Glocker B. Efficient multi-scale 3D CNN with fully connected CRF for accurate brain lesion segmentation. MED IMAGE ANAL. 2017;36:61–78. doi: 10.1016/j.media.2016.10.004. [DOI] [PubMed] [Google Scholar]
- 29.Lyu J, Ling SH: Using multi-level convolutional neural network for classification of lung nodules on CT images. In: 2018 40th Annual International Conference of the IEEE Engineering in Medicine and Biology Society. IEEE, 2018, pp 686-689 [DOI] [PubMed]
- 30.Xie Y, Zhang J, Xia Y, Fulham M, Zhang Y. Fusing texture, shape and deep model-learned information at decision level for automated classification of lung nodules on chest CT. INFORM FUSION. 2018;42:102–110. [Google Scholar]
- 31.Xie Y, Xia Y, Zhang J. Knowledge-based Collaborative Deep Learning for Benign-Malignant Lung Nodule Classification on Chest CT. IEEE T MED IMAGING. 2019;38(4):991–1004. doi: 10.1109/TMI.2018.2876510. [DOI] [PubMed] [Google Scholar]
- 32.Causey JL, Zhang J, Ma S, Jiang B, Qualls JA, Politte DG, Prior F, Zhang S, Huang X. Highly accurate model for prediction of lung nodule malignancy with CT scans. SCI REP-UK. 2018;8:9286. doi: 10.1038/s41598-018-27569-w. [DOI] [PMC free article] [PubMed] [Google Scholar]


