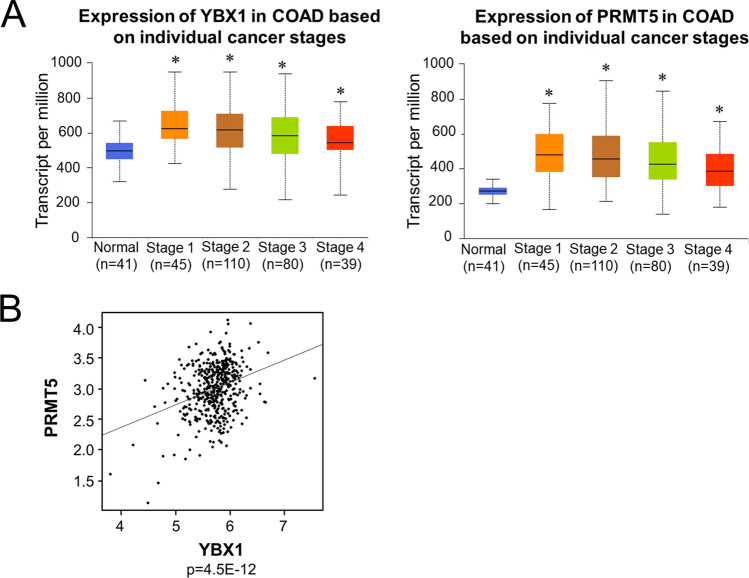
Figure 8.
YBX1 and PRMT5 are highly amplified and are significantly correlated in CRC patient samples. (A) Box-whisker plots showing transcript levels of YBX1 (left panel) and PRMT5 (right panel) across colorectal adenocarcinoma (COAD) tumors and normal based on individual cancer stages. Individual cancer stages were based on AJCC (American Joint Committee on Cancer) pathologic tumor stage information and samples were divided into stage I, stage II, stage III and stage IV group. Courtesy of UALCAN web-portal, publicly
available at https://ualcan.path.uab.edu. (B) Scatter plot showing the expression level of YBX1 (x-axis) and PRMT5 (y-axis). Each dot represents log-transformed fragments per kilobase of transcript per million mapped reads (FPKM) for individual samples. To obtain data, 459 TCGA colorectal adenocarcinoma tumor samples was queried from cBioPortal using R package CGDS-R (https://cran.r-project.org/web/packages/cgdsr). The Pearson correlation was conducted between PRMT5 and YBX1 to detect how much two genes are related. The above analyses were conducted in statistical environment R v3.6 and p value less than 0.05 was considered as statistically significant, and Bonferroni correction is used in place of multiple-comparison. R2 = 0.04868.

