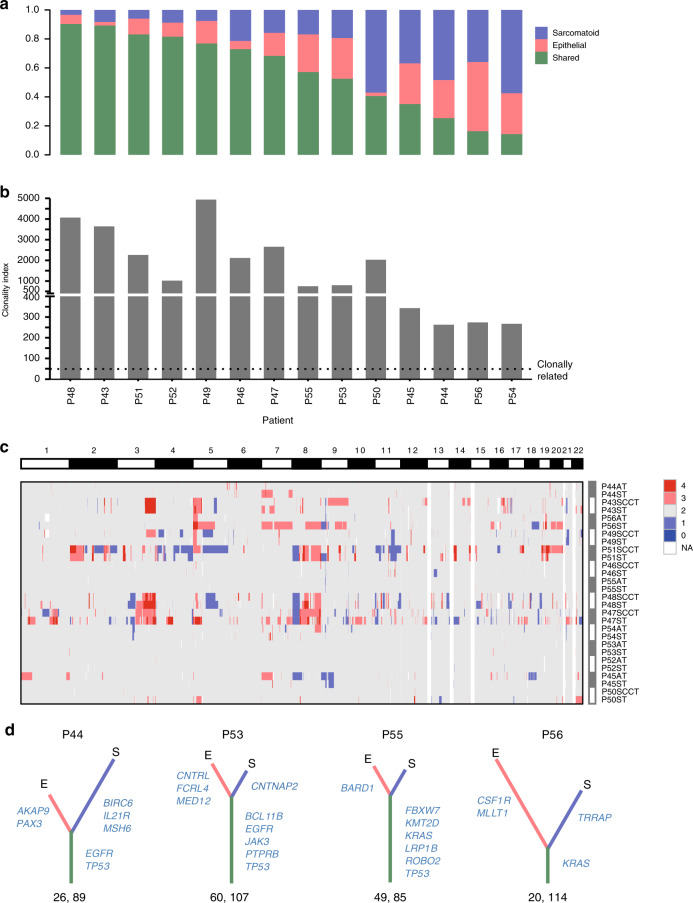
Fig. 2. Establishing the clonal relationship between the epithelial and sarcomatoid components within the same tumor.
a Columns depict the proportion of shared and specific somatic mutations of the 14 tumors microdissected. b Clonality indices for the 14 cases of PSC, suggesting the likelihood of common origin of the two components. Black dotted lines represent the cut-off value of clonality index to define clonal relatedness. c The distribution of copy number variations (CNVs) for all PSC samples microdissected. Red indicates CNV gain, and blue CNV loss. White represents the failure in CNV calling. AT, adenocarcinoma component; SCCT, squamous cell carcinoma component; ST, sarcomatoid component. Source data are provided as a Source data file. d Phylogenetic trees generated for 4 PSC samples. The length of the trunk (green) and branch (red or blue) represents the number of shared and specific nonsynonymous mutations, respectively. Part of driver mutations is marked. The number of truncal and total nonsynonymous mutations is indicated below. E and S represent epithelial and sarcomatoid component, respectively.

