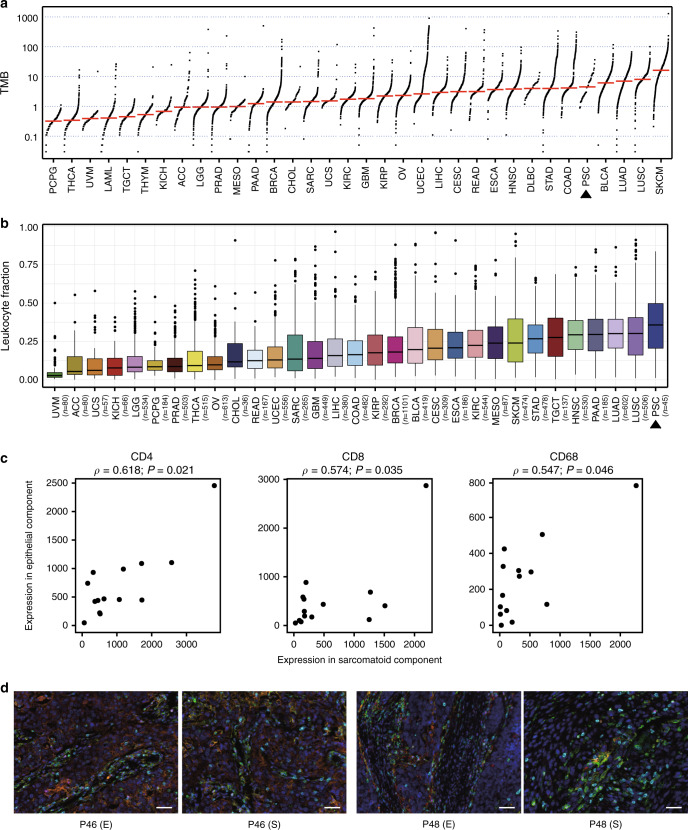
Fig. 4. Tumor immune microenvironment of PSC.
a Tumor mutation burden (TMB) of pulmonary sarcomatoid carcinoma (PSC) and The Cancer Genome Atlas (TCGA) tumor types, ordered by median. Somatic single-nucleotide variants and small indels of PSC were called using MuTect (version 3.1-0-g72492bb) and Strelka (version 1.0.14) via an in-house computational pipeline, and the mutation list of TCGA cancer types was released by the Pan-Cancer Atlas consortium (https://gdc.cancer.gov/about-data/publications/pancanatlas, mc3.v0.2.8.PUBLIC.maf.gz). b Leukocyte fraction (LF) of PSC and TCGA tumor types, ordered by median. The LF of all TCGA samples was collected from a previous study, and we estimated the LF of PSC using the algorithm provided by the same study58. Center line, median; box limits, upper and lower quartiles; whiskers, 1.5× interquartile range; points, outliers. c Spearman correlation of the fluorescence intensity of CD4, CD8, and CD68 between epithelial and sarcomatoid components. Source data are provided as a Source data file. d Representative images of fluorescent multiplex immunohistochemical analysis of P46 and P48. E and S represent epithelial and sarcomatoid components, respectively. Scale bar: 50 μm. The fluorescent multiplex immunohistochemical analysis was performed on the epithelial and sarcomatoid components of 14 patients. CD4, green; CD8, cyan; CD68, red; PD-L1, orange; FOXP3, magenta. CD4, cluster of differentiation 4; CD8, cluster of differentiation 8; CD68, cluster of differentiation 68.

