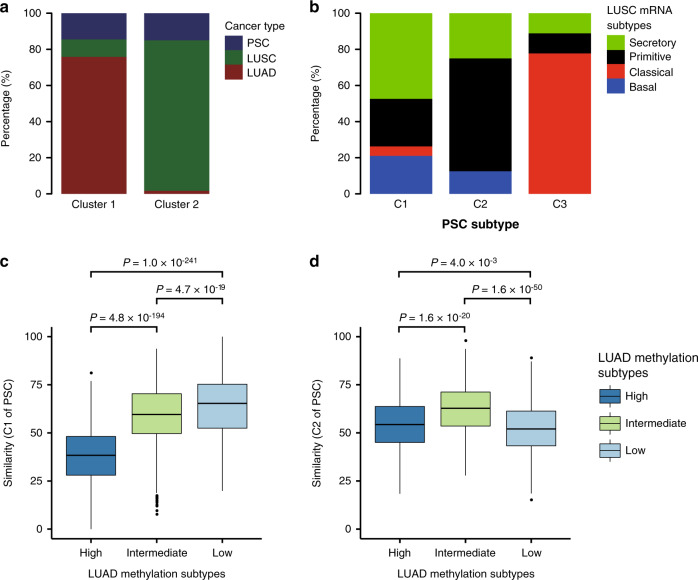
Fig. 6. Integrated analysis of PSC, LUSC and LUAD.
a The percentage of PSC, LUSC, or LUAD in the two major clusters yielded by unsupervised hierarchical clustering of DNA methylation data. b The proportion of the four LUSC subtypes in three clusters of PSC. Source data are provided as a Source data file. c Boxplots show the Euclidean distance-based similarity between the DNA methylation profiles of C1 and three LUAD methylation subtypes. Source data are provided as a Source data file. d Boxplots show the Euclidean distance-based similarity between the DNA methylation profiles of C2 and three LUAD methylation subtypes. Center line, median; box limits, upper and lower quartiles; whiskers, 1.5× interquartile range; points, outliers. Two-sided Wilcoxon rank-sum test was used for statistical analysis of (c) and (d). No P-value adjustment was applied. Source data are provided as a Source data file.

