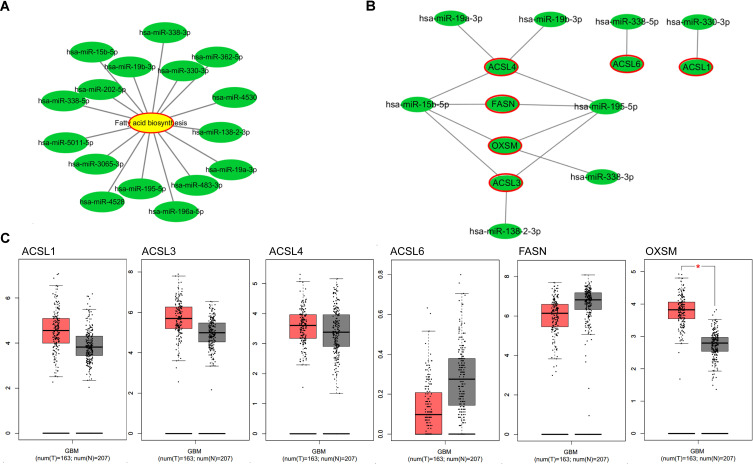
Figure 3.
Fatty acid metabolism regulated by DE-miRNAs. (A) Network diagram of the DE-miRNAs and fatty acid biosynthesis produced by Cytoscape. (B) Network diagram of the upregulated miRNAs or downregulated miRNAs in all type of samples and their target genes in pathway of fatty acid biosynthesis produced by Cytoscape; (C) the expression levels of target genes in pathway of fatty acid biosynthesis from the GEPIA database. *P < 0.05.

