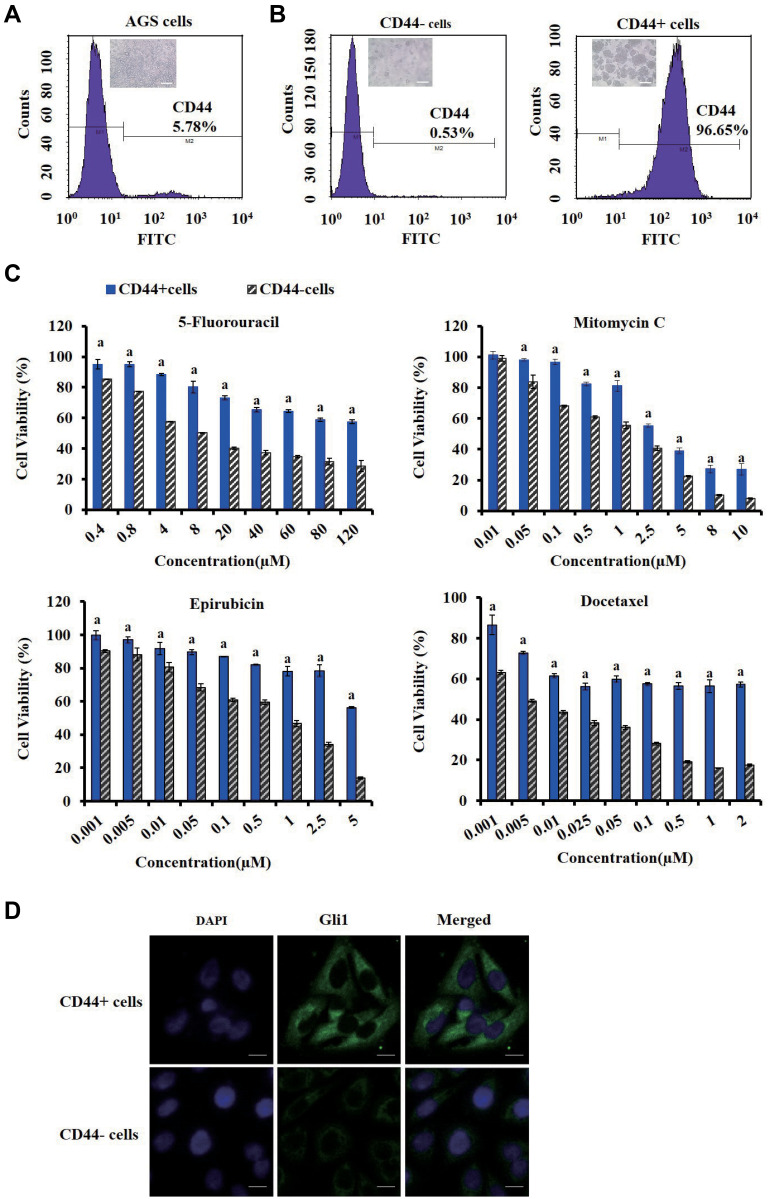
Figure 3.
Identification of CD44 and Gli1 in gastric cancer stem cells (CSCs). (A) Expression of CD44 marker of AGS cells stained with FITC-conjugated CD44 antibody by fluorescence-activated cell sorting (FACS) analysis. (B) The purity of CD44+ and CD44− cells dissociated from the tumor spheroids in serum-free medium. Those cells were stained with FITC-conjugated CD44 antibody and subjected to flow cytometry analysis to determine the CD44 expression. (C) Comparison of chemo-resistance between CD44+ and CD44− cells. CD44+ and CD44− cells were exposed to a series of concentrations of 5-fluorouracil (0.4−120µM), mitomycin C (0.01−10µM), epirubicin (0.001−5µM) and docetaxel (0.001−2µM), respectively. The CCK-8 assay was performed at the end of incubation. (D) Immunofluorescence analysis of Gli1 in CD44+ and CD44− cells using laser scanning confocal microscopy. Cells fixed by paraformaldehyde were stained with anti-Gli1 antibodies followed by incubation with fluorescent secondary antibodies and DAPI staining of the nucleus. Green staining denotes the anti-Gli1 antibody and blue indicates the nuclei of CD44+ or CD44− cells. Scale bars indicate 20 μm.
Note: a Indicates p < 0.05 as compared with CD44− cells.

