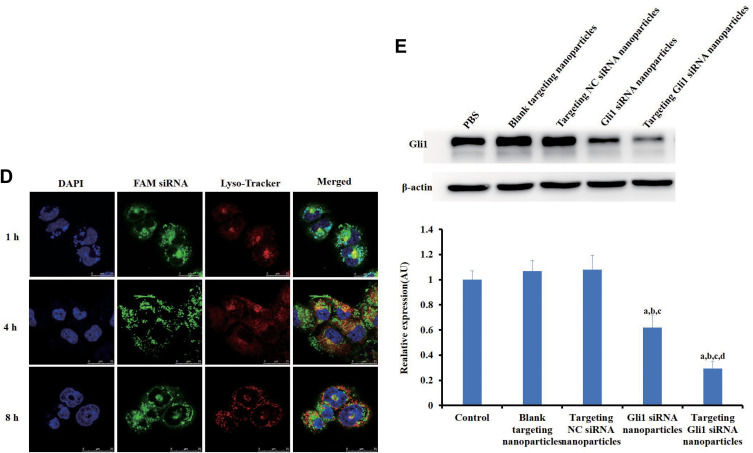
Figure 4.
Effects of targeting CD44+ and Gli1 in gastric cancer stem cells (CSCs). (A) The binding affinity to recombinant human CD44 receptor of the di-stearoyl-phosphatidyl-ethanolamine-hyaluronic-acid (DSPE-HA) single-point and multipoint conjugates, analyzed by enzyme-linked immunosorbent assay (ELISA). Error bars indicate SD for n = 3. (B) A competitive binding assay was used to determine cellular uptake in CD44+ cells after treatment with either non-targeting or targeting FAM siRNA nanoparticles, with and without HA preincubation. After the culture medium was replaced by fresh OPTI-MEM, the cells were incubated with various formulations containing 100 nM FAM siRNA for 3h. The assay was analyzed using flow cytometry. The upper and lower panels show the images of flow cytometry analyses and quantitative evaluation of the mean fluorescent intensities, respectively. (C) Intracellular accumulation of siRNAs in CD44+ cells was investigated by laser scanning confocal microscopy analysis. The CD44+ cells were treated with free FAM siRNA, FAM siRNA nanoparticles, targeting FAM siRNA nanoparticles, or pre-treated with HA for 30 min followed by treatment with targeting FAM siRNA nanoparticles. Blue staining indicates the nuclei of CD44+ cells stained with DAPI while green indicates FAM siRNA. All data shown are representative of three independent experiments. a, b, c, and d: p < 0.05, compared with the control, free FAM siRNA, FAM siRNA nanoparticles, and targeting FAM siRNA nanoparticles, respectively. Scale bars indicate 20 μm. (D) Localization and distribution of targeting FAM siRNA nanoparticles in CD44+ cells. Lysosomes were visualized as red fluorescence due to staining of the cells with Lyso-Tracker Red DND-99; targeting FAM siRNA nanoparticles were visualized as green fluorescence. Blue indicates nuclei stained with Hoechst 33342. The red and green staining indicates non-colocalization of nanoparticles and lysosomes while yellow demonstrates colocalization of nanoparticles with lysosomes. Scale bars indicate 25 μm. (E) Gli1 expression levels in CD44+ cells treated with different Gli1 siRNA formulations were determined by Western blot analysis. Band intensities were quantified using ImageJ software. Data are presented as the mean ± SD (n = 3).
Notes: a,bIndicate p < 0.05 as compared with the HA and DSPE-HA single-point conjugate, respectively. a-dIndicate p < 0.05 as compared with the control, blank targeting nanoparticles, targeting NC siRNA nanoparticles, and Gli1 siRNA nanoparticles, respectively.

