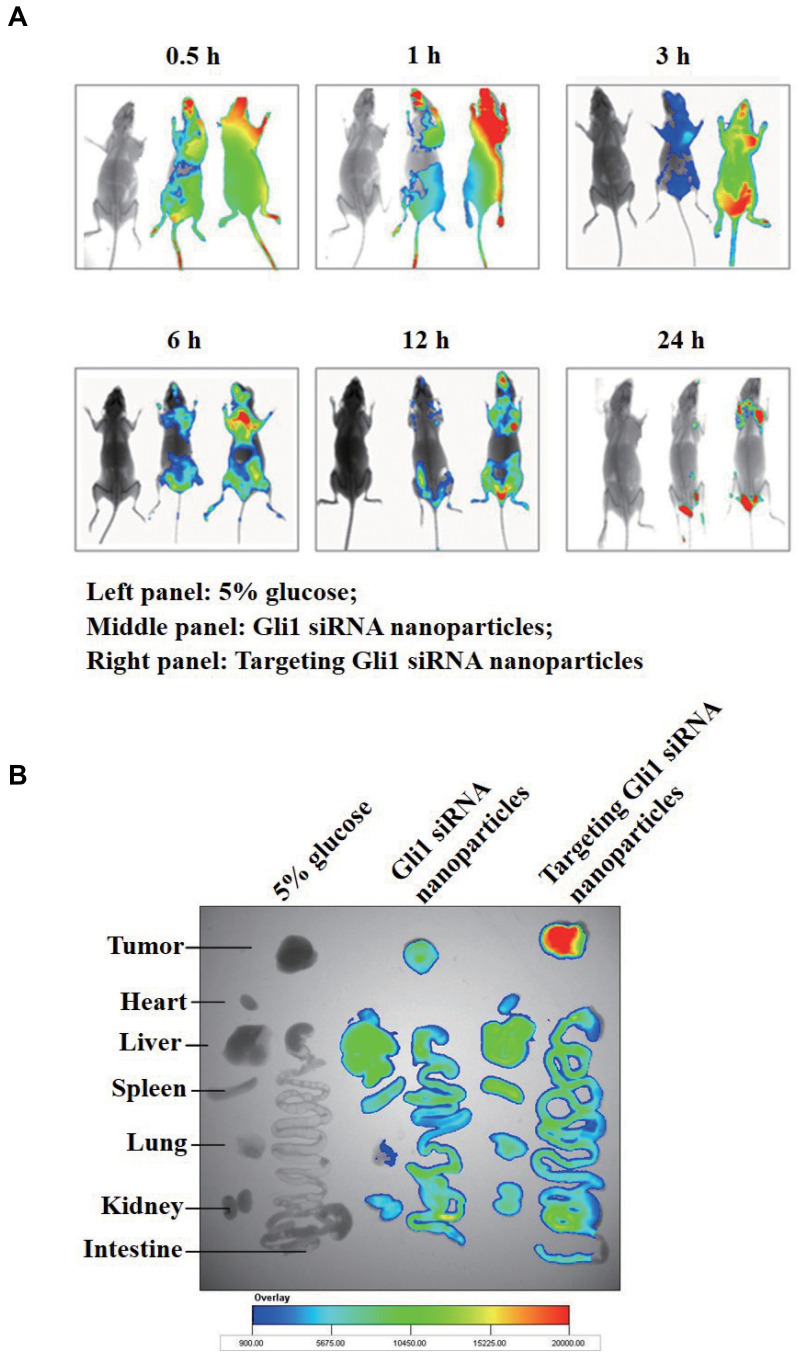
Figure 8.
Specific in vivo distribution of Cy5.5-labeled siRNA in relapsed tumors (n = 3 mice/group). (A) In vivo imaging of relapsed tumors induced from AGS-derived gastric cancer stem cells (CSCs) in mice 0.5 h, 1 h, 3 h, 6 h, 12 h, and 24 h after intravenous injection of 5% glucose (left panel), Gli1 siRNA nanoparticles (middle panel), and targeting Gli1 siRNA nanoparticles (right panel). (B) Ex vivo optical images of tumors and organs of mice sacrificed after 24 h of treatment.

