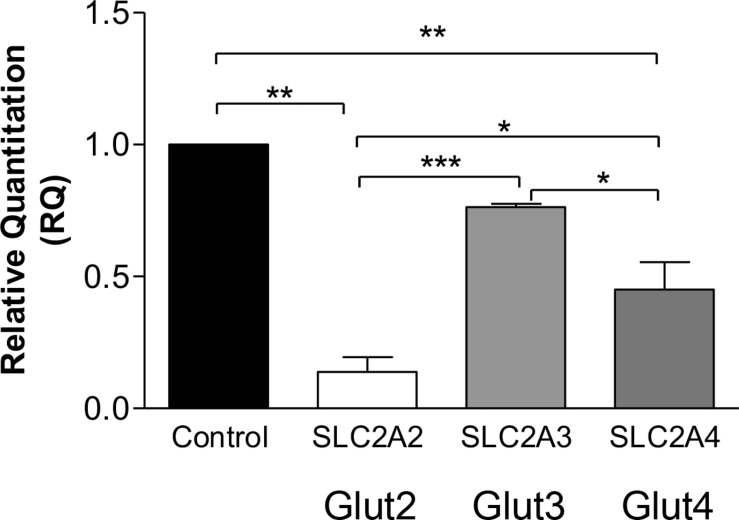
FIGURE 1.
Glucose transporters gene expression in CADASIL compared to control VSMCs. qRT-PCR analysis of GLUT2 (SLC2A2), GLUT3 (SLC2A3), and GLUT4 (SLC2A4), genes in CADASIL and control VSMCs. The expression of GLUT2, GLUT3, and GLUT4 genes were normalized to the endogenous control gene; HPRT1, and the RQ (Relative Quantitation) was calculated using control VSMC normalized to 1. *p < 0.05, **p < 0.01 and ***p < 0.001. The results are representative of three independent replicates (n = 3). One-way ANOVA followed by Bonferroni’s post hoc test was used for statistical analysis.

