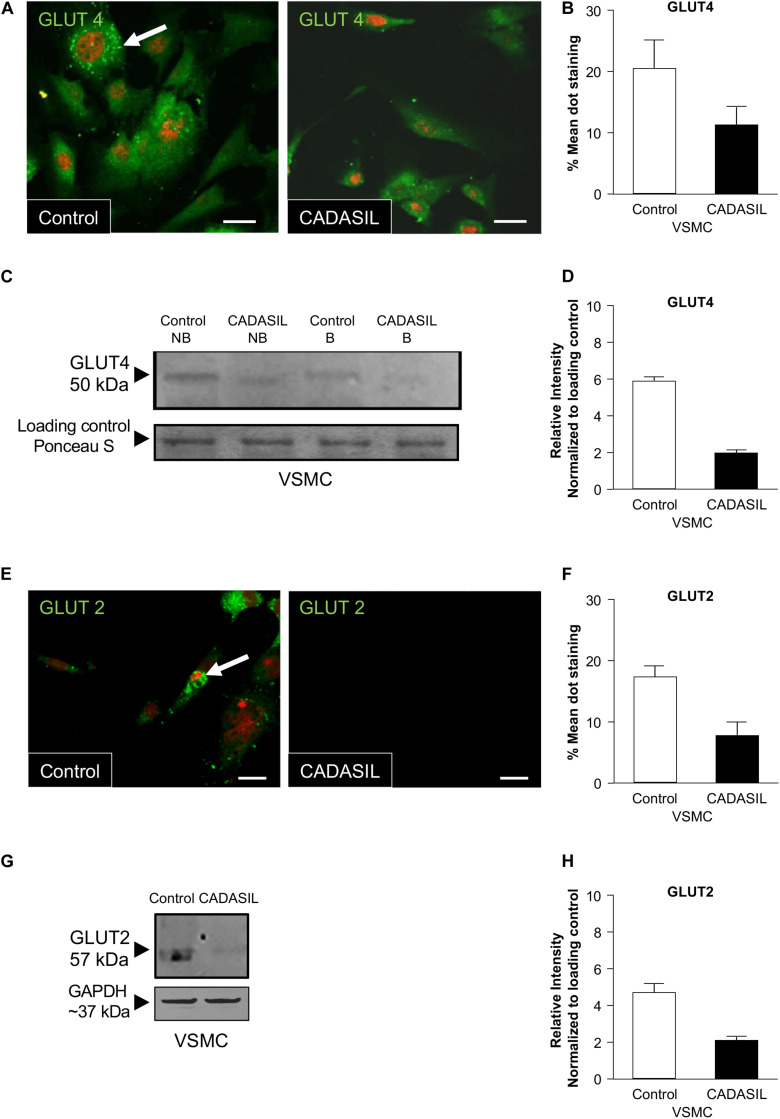
FIGURE 2.
GLUT4 expression in CADASIL compared to control VSMCs. PFA-fixed VSMCs were immunostained with goat anti-GLUT4 and GLUT2 antibodies, visualized using confocal microscopy and assessed for expression of the GLUTs. (A,E) Images of VSMCs stained for GLUT4 and GLUT 2 using an Alexa Fluor-conjugated 488 secondary antibody. GLUT dot-staining is shown in green (arrows) and Nuclei are stained with DAPI (here showed in fluoresces red). Representative images were taken from one experiment (n = 3), Scale bar, 10 μm. (B,F) Mean values of GLUT4 and GLUT2 dot-staining in control and CADASIL VSMCs. Each data point represents mean of intensely fluorescent GLUT-positive dots per cell in 12 cells from 3 independent experiments (n = 3) (*p < 0.05). (C,G) Immunoblotting analyses, non-boiled (NB) and boiled samples (B) were conducted to assess the expression of GLUT4 in VSMCs. The samples were visualized using the Odyssey CLx Imager. 15 μg of protein was loaded into the gel and ponceau S staining was used as loading control. The intensity of the GLUT4 and GLUT2 band was lower than in both CADASIL boiled and non-boiled samples as compared to control VSMC lysates (D,H) Densitometry data from CADASIL and control protein bands normalized to Ponceau S total protein stain showed lower expression of GLUT4 and GLUT2 in CADASIL VSMCs than in controls. The immunoblot is representative of one experiment.

