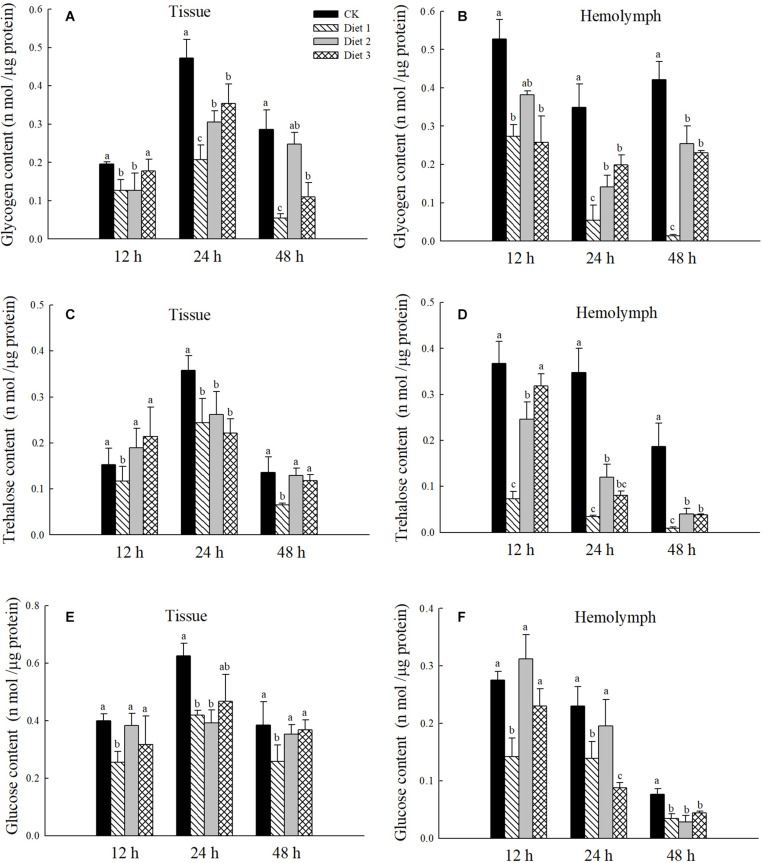
FIGURE 1.
After 12, 24, and 48 h of fed with three kinds of artificial feedstuffs, the sugar content in the larval tissue and hemolymph of H. axyridis. (A) The glycogen content in the tissue. (B) The trehalose content in the tissue. (C) The glucose content in the tissue. (D) The glycogen content in the hemolymph. (E) The trehalose content in the hemolymph. (F) The glucose content in the hemolymph. Line bars represent standard error of the mean. Bars with different letters are significantly different (Tukey–Kramer tests, P < 0.05). Numbers of samples for each treatment of hemolymph = 7. Sample size for each treatment of tissue = 3.

