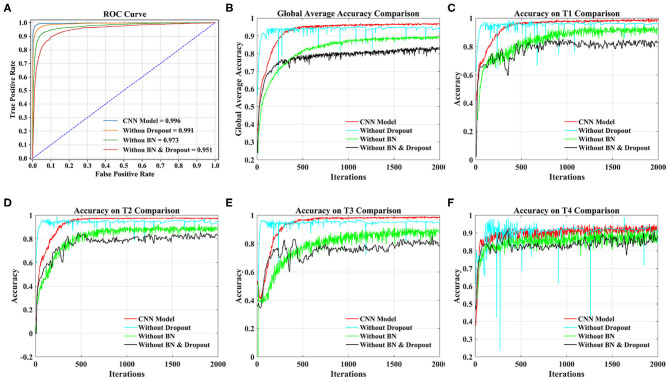
Figure 8.
Comparison of different models under 20 subjects dataset. (A) Comparison of ROC curve and AUC of different models. (B) Comparison of the global average accuracy of different models. (C) Comparison of accuracy on T1 (left fist) of different models. (D) Comparison of accuracy on T2 (right fist) of different models. (E) Comparison of accuracy on T3 (both fists) of different models. (F) Comparison of accuracy on T4 (both feet) of different models.

