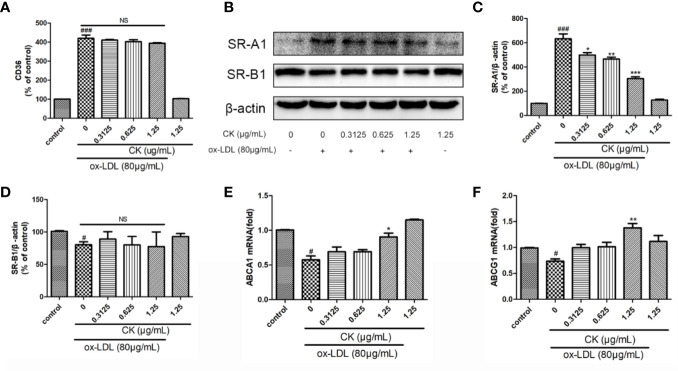
Figure 2.
CK inhibited ox-LDL-induced foam cell formation. RAW264.7 cells were treated with CK at various concentrations for 12 h with or without 80 μg/ml ox-LDL for additional 24 h. (A) CD36 expression level was tested by flow cytometry. (B) The protein expression levels of SR-A1, SR-B1 and β-actin were examined by western blot assay. (C) Statistical results of SR-A1 protein level relative to β-actin. (D) Statistical results of SR-B1 protein level relative to β-actin. (E) The ABCA1 mRNA expression level was determined by RT-PCR assay. (F) The ABCG1 mRNA expression level was determined by RT-PCR assay. All data are shown as mean ± SD from three independent experiments with each performed in triplicate. #P < 0.05, ###P < 0.001 vs. control group; *P < 0.05, **P < 0.01, ***P < 0.001 vs. ox-LDL-treated group. NS, no significance; CK, compound K; ox-LDL, oxidized low-density lipoprotein; SR-A1, scavenger receptor-A1; SR-B1, scavenger receptor-B1; ABCA1, ATP binding cassette subfamily A member 1; ABCG1, ATP binding cassette subfamily G member 1.

