Figure 4.
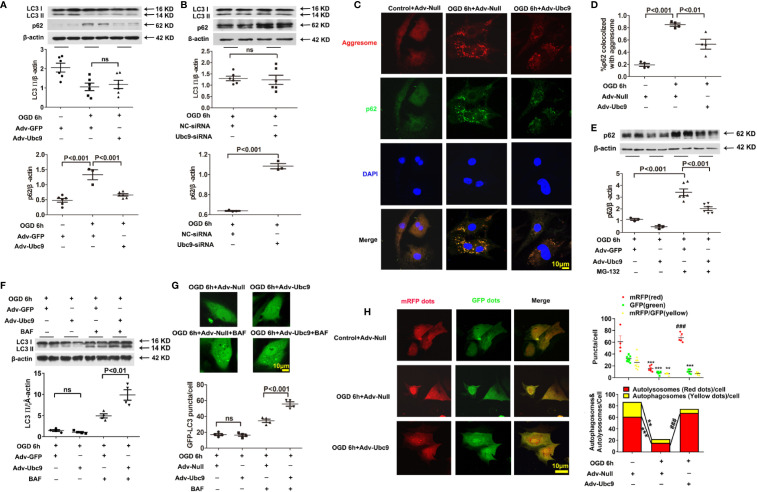
Ubc9 ameliorates the impaired autophagic flux through increasing autophagy formation and autophagy degradation NRCMs were treated with Adv-Ubc9 (or Adv-Null) or Ubc9-siRNA (or NC-siRNA) for 48 h. After that, OGD was applied for 6 h. (A, B) Western blotting analysis of LC3 Ⅱ and p62, n = 3–6 per group. (C, D) Representative images and quantitative analysis of p62 colocalized with aggresomes. Aggresomes were visualized with an aggresome detection kit (red), and p62 was visualized by immunostaining with antibody (green), n = 4 per group. (E) NRCMs were treated with Adv-Ubc9 or Adv-GFP for 24 h, and then co-treated with MG-132 (1 μM) for another 24 h. After that, OGD was applied for 6 h, co-treating with MG-132 (1 μM). Western blotting analysis of p62, n = 3–6 per group. (F) NRCMs were treated with Adv-Ubc9 or Adv-GFP for 46 h, and then co-treated with BAF (50 nM) for another 2 h. After that, OGD was applied for 6 h, co-treating with BAF (50 nM). Western blotting analysis of LC3 Ⅱ, n = 4 per group. (G) After Adv-Ubc9 or Adv-Null was transfected for 12 h, Adv-GFP-LC3 or Adv-Null was co-transfected for another 34 h. Next, BAF (50 nM) was applied for another 2 h. After that, OGD was applied for 6 h, co-treating with BAF (50 nM). Representative images and number statistics of GFP-LC3 puncta (green) per cell, n = 4 per group. (H) NRCMs were treated with Adv-Ubc9 or Adv-Null for 12 h, and then co-transfected with Adv-mRFP-GFP-LC3 for another 48 h. After that, OGD was applied for 6 h. Representative images and number statistics of GFP dots (green), mRFP dots (red), autophagosomes, and autolysosomes per cell, **P < 0.01, ***P < 0.001 vs. the controls; ###P < 0.001 vs. the OGD 6h+Adv-Null group, n = 4–9 per group. Data were analyzed by one-way ANOVA, followed by a Bonferroni post-hoc test, or analyzed by unpaired Student’s t test.

