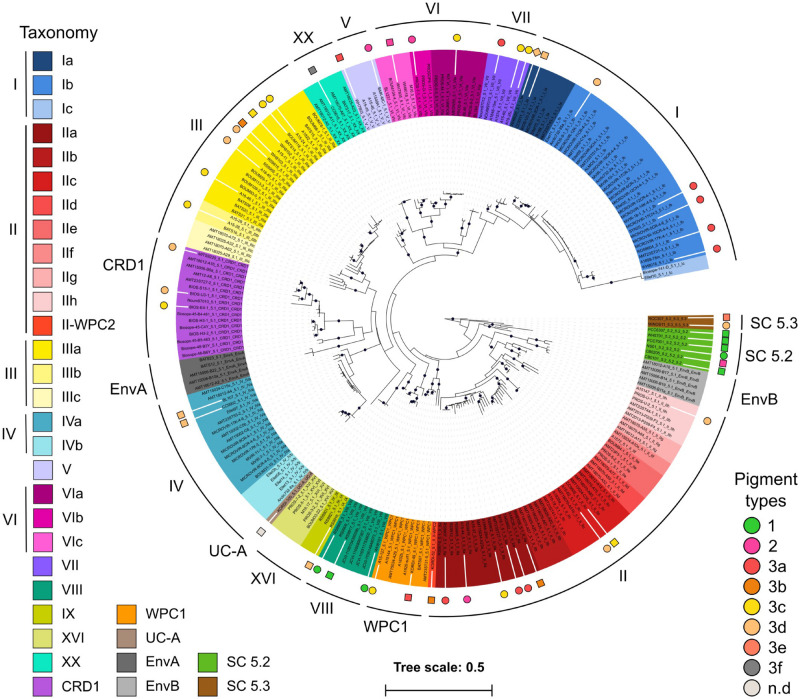
FIGURE 1.
Phylogenetic position of the 53 mostly marine Synechococcus and Cyanobium genomes used in this study. A maximum-Likelihood tree was generated based on 231 petB sequences from both cultured and environmental samples. Black dots indicate bootstrap support over 70%. Sequences were named after strain name_sub-cluster_clade_subclade [sub-clade assignments as in Farrant et al. (2016)] and the background colors correspond to the finest possible taxonomic resolution obtained for each strain using the petB marker gene (left hand side legend). Colored circles surrounding the tree indicate newly sequenced genomes, while squares indicate previously available ones. Note that the WH8020 genome indicated by a diamond was not used in this study due to its poor quality. Symbols are colored according to their pigment type as defined previously (Humily et al., 2014; Xia et al., 2017b; Grébert et al., 2018; right hand side legend).

