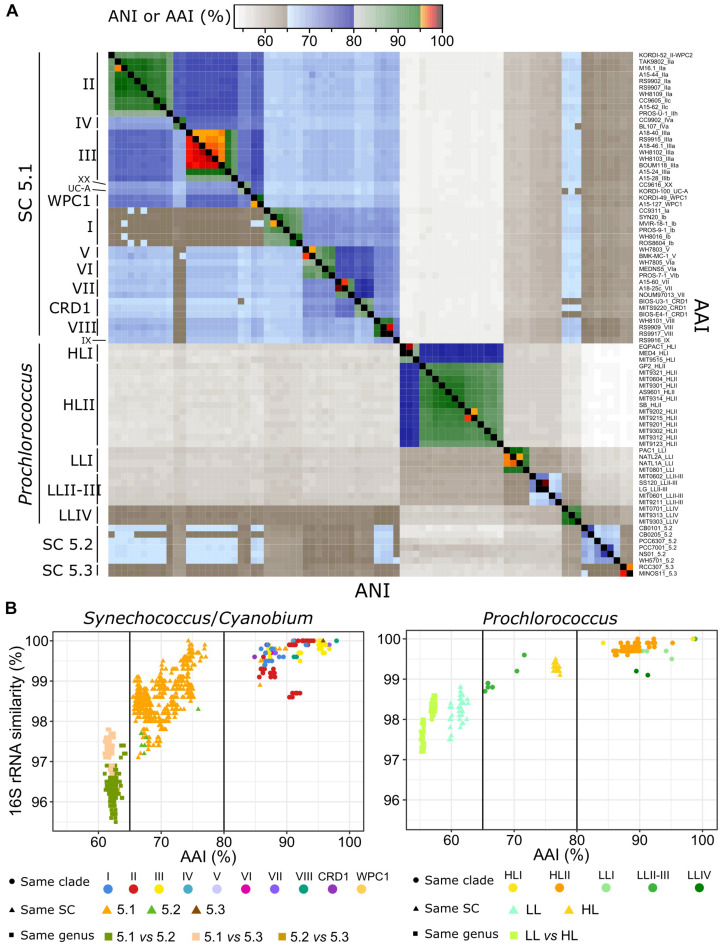
FIGURE 3.
Genomic diversity of marine picocyanobacteria. (A) Heatmap of average nucleotide identity (ANI, bottom left triangle) and average amino acid identity (AAI, upper right triangle) between pairs of genomes. Each lane corresponds to a strain, and strains are ordered according to their phylogenetic relatedness. Strains are as labeled as strain_subclade (or higher taxonomic level when no sub-clade has been defined). (B) Relationships between 16S rRNA identity, AAI, and taxonomic information for Synechococcus/Cyanobium (left panel) and Prochlorococcus (right panel) genomes. Dots correspond to comparisons between pairs of genomes belonging to the same clade, triangles between pairs of genomes belonging to the same SC but different clades and squares between pairs of genomes belonging to different SC.

