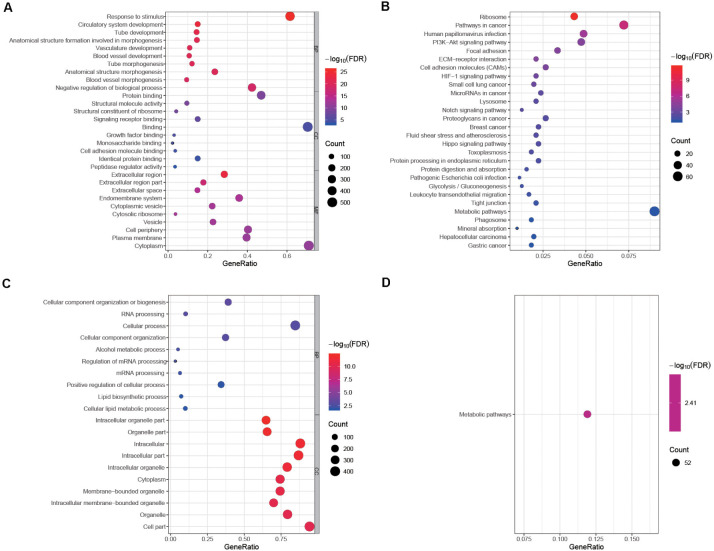
FIGURE 2.
Enrichment analyses of differentially expressed mRNAs and DEPs. The top 10 biological process GO terms, cellular component GO terms, molecular function GO terms of (A) differentially expressed mRNAs and (B) DEPs sorted by false discovery rate (FDR) value. Significantly enriched KEGG pathways of (C) differentially expressed mRNAs and (D) DEPs. Some functions and pathways related to cell proliferation, adhesion and angiogenesis are not shown in this figure because the corresponding FDR values are not in the top 10. No molecular function GO term was enriched in the GO analysis of DEPs, so this part is not shown in (B).

