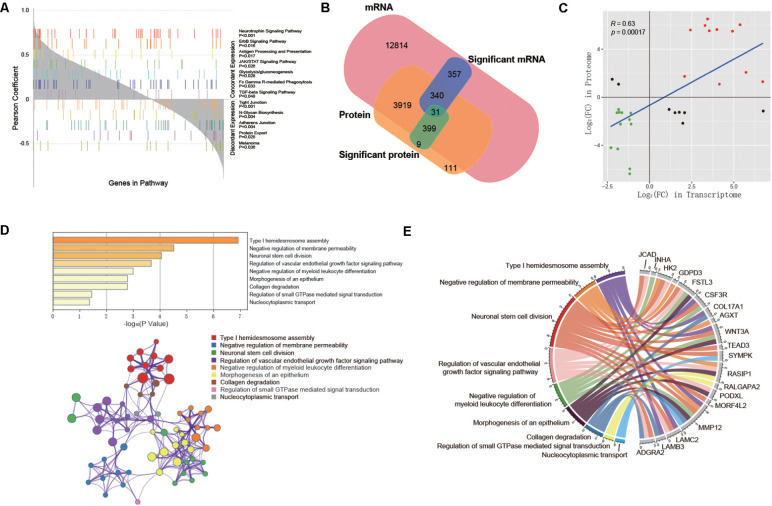
FIGURE 5.
Integrative analysis between transcriptome and proteome. (A) KEGG pathways significantly correlated with concordant or discordant mRNA-protein expressions. Genes are aligned along the x axis by the rank of their Pearson correlation coefficient between mRNA and protein expression levels. Each color represents one significantly associated pathway, and each bar represents one gene in the pathway. (B) Venn diagram showing all identified mRNAs and proteins and their overlap. (C) The expression levels of 31 co-differentially expressed genes in the transcriptome and proteome. (D) Functional enrichment analysis based on Metascape. Bar graph demonstrates P-value of enriched clusters. Each node in network represents an enriched term of corresponding clusters. For large clusters, the network only displays the top 10 terms with P-value. The edge reflects the connection of functions and pathways. The size of the nodes reflects the number of genes, and the thickness of the edges reflects correlation level of terms (E) Chord diagram shows the hub genes with their representative enriched clusters.

