FIGURE 4.
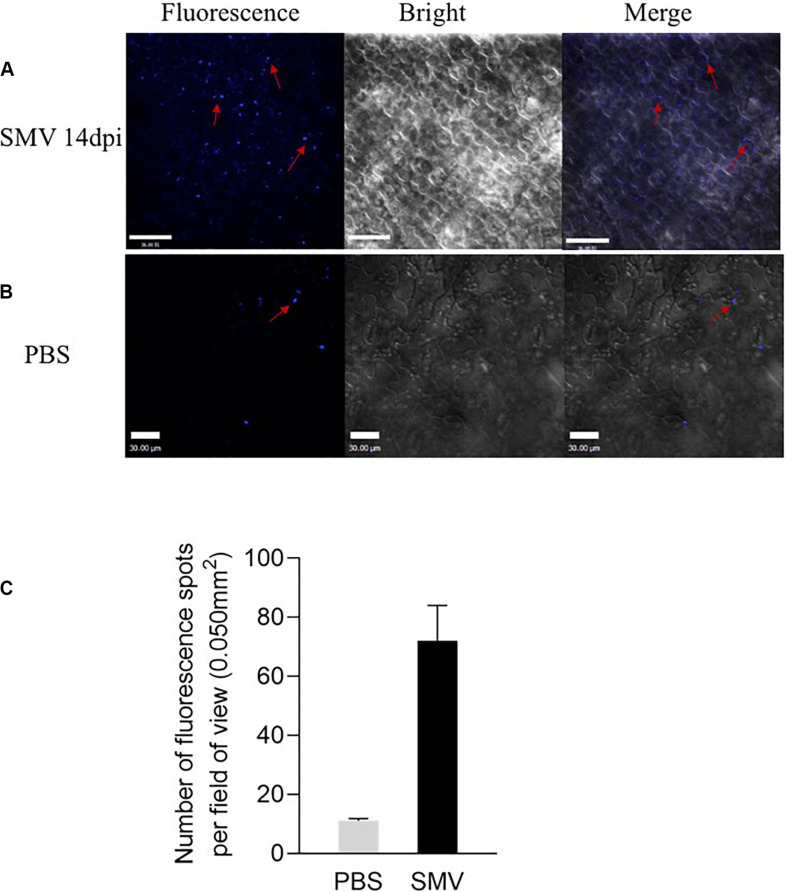
Fluorescence spots at the inoculation sites detected from soybean cv. Nannong 1138-2 leaves inoculated with SMV strain SC-15. (A) Lots of Fluorescence spots were detected as uneven distribution on the cell membrane 14 days post-inoculation. (B) A few of callose deposition, caused by friction was observed as negative control. Bar indicates 30 μm. (C) Number of fluorescence spots per field of view (0.050 mm2), as indicated callose deposition in systemically infected leaves at 14 dpi. Three plants were examined in each treatment, two small areas of each plant were inoculated, and five fields of view are randomly observed in each area. Error bars represent the standard deviation from 30 fields of view and data were from three independent experiments.

