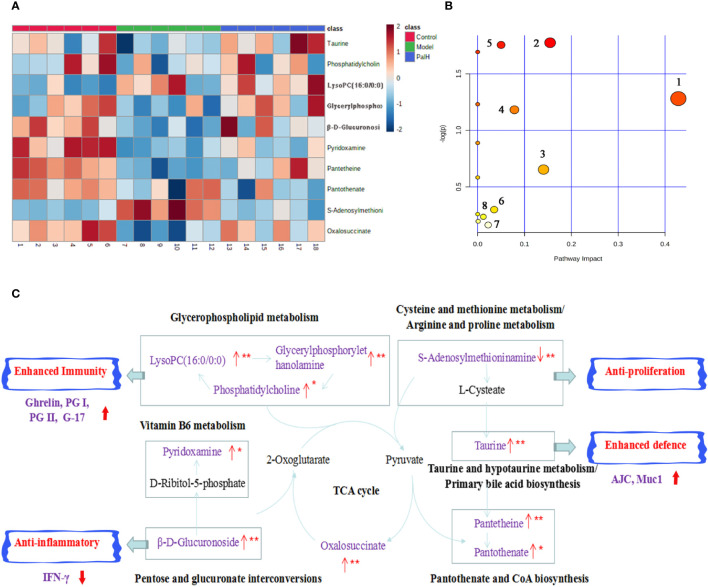
Figure 11.
Pathway analysis of Pal treatment. (A) The heatmap of 10 potential metabolites. (B) Metabolomic pathway construction of the metabolic pathways involved in the effects of Pal on chronic atrophic gastritis (CAG). (C) Signaling networks associated with the differentially expressed metabolic pathways. Red represents the detected metabolite.

