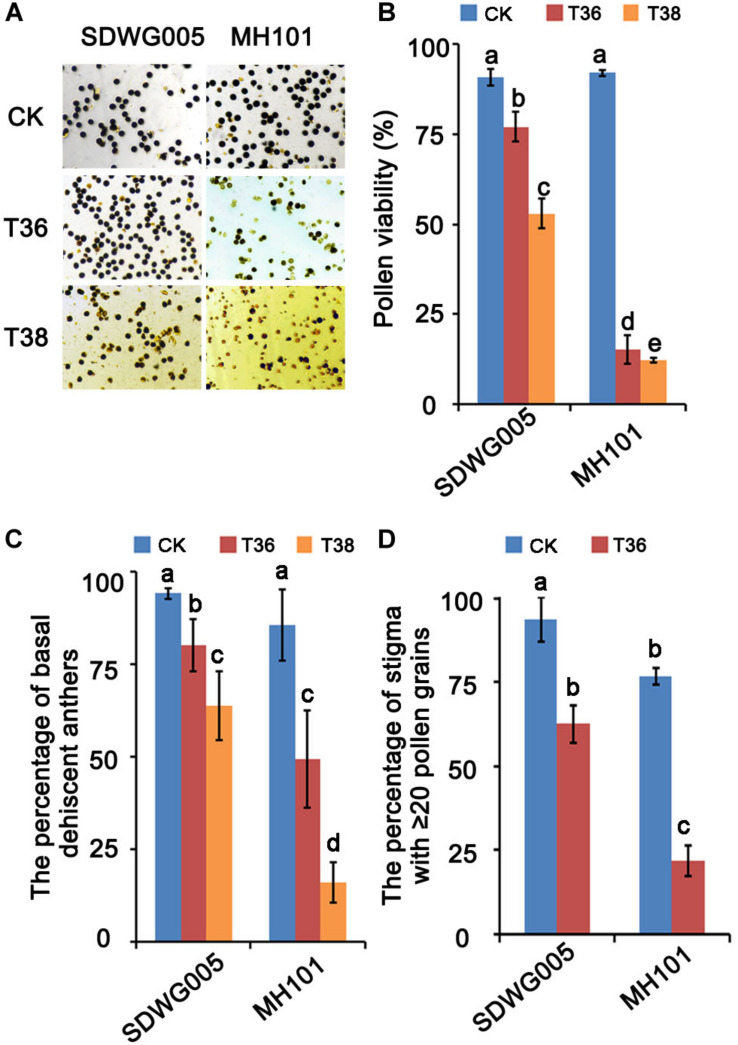
FIGURE 1.
Effect of heat stress on pollen viability and pollination properties of SDWG005 and MH101. (A,B) Differences in pollen viability of SDWG005 (heat-tolerant) and MH101 (heat-susceptible) exposed eight days to different temperature treatments. (C) The percentage of basal dehiscent anthers under high-temperature treatments. (D) The percentage of stigma with ≥ 20 pollen grains at anthesis. CK, T36 and T38 indicate normal temperature (Tmax = 28°C) and high temperatures T36 (Tmax = 36°C) and T38 (Tmax = 38°C). Each data point represents the mean ± SD (n = 3) of three biological replicates. Significant differences are calculated by One-way ANOVA with Duncan’s multiple test (SAS Institute, Inc., Cary, NC, United States). Different letters indicate statistical differences between samples at P = 0.05.

