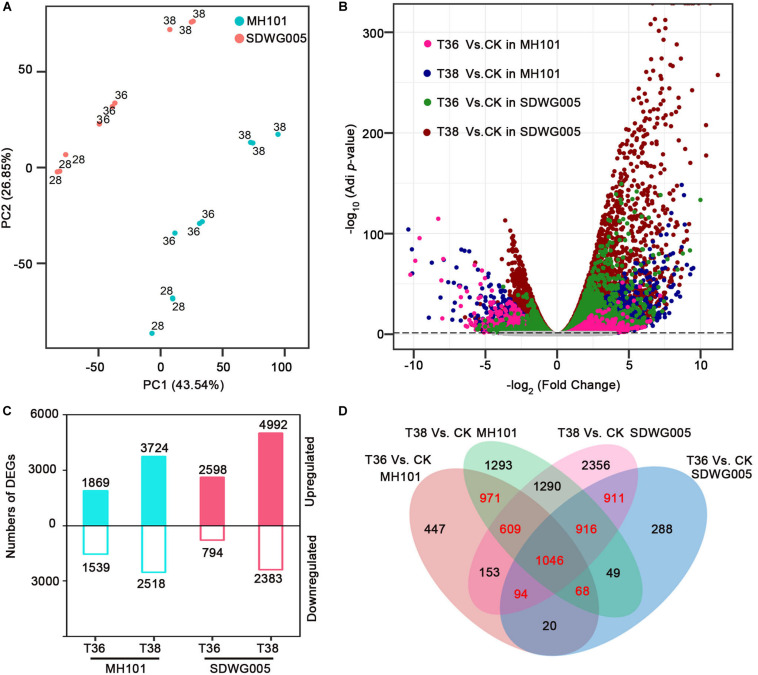
FIGURE 3.
Analysis of DEGs in rice varieties in response to heat stress. (A) PCAs of log2 transformed raw read counts for CK, T36, and T38 for MH101 and SDWG005, respectively. (B) Volcano plot of expressed genes under different heat stress. Log2 transformed FC was plotted against the -log10 transformed adjusted P-value. Pink, blue, green and red dots represent DEGs of T36 relative to CK in MH101, T38 relative to CK in MH101, T36 relative to CK in SDWG005, T38 relative to CK in SDWG005, respectively. The gray line represents the –log10 transformed adjusted P-value cutoff. (C) Number of up- (log2FC ≥ 1 and FDR adjusted P-value ≤ 0.05) and down-regulated (log2FC ≤ -1 and FDR adjusted P-value ≤ 0.05) DEGs detected under different heat stress treatments relative to control for MH101 and SDWG005, respectively. (D) Venn’s diagram of the comparison of DEGs under different heat stress treatments in MH101 and SDWG005.

