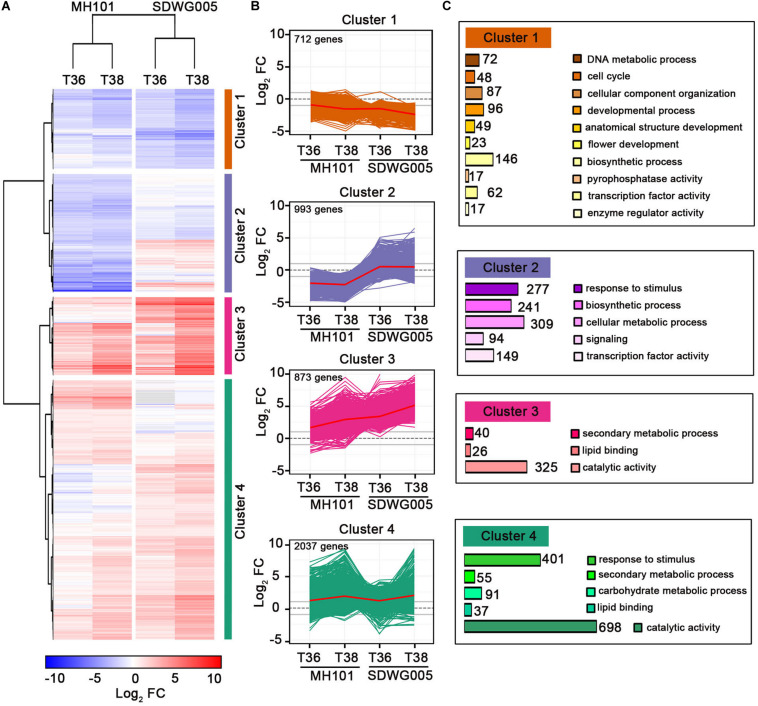
FIGURE 4.
Global patterns of gene expression during heat stress. (A) Hierarchical clustering analysis to reveal the transcript expression patterns of DEGs in MH101 and SDWG005 spikelets subjected to different high temperature treatments (T36 or T38). Colored bars show the fold changes of gene expression under T36 and T38 treatments compared to their corresponding controls. (B) Gene expression profiles in clusters 1, 2, 3, and 4 as indicated. Lines reflected expression changes for each DEGs across different treatments. The mean changes of expression in each cluster are shown with a red line. (C) GO categories of DEGs enriched in each cluster. The number show the DEGs enriched in each GO categories.

