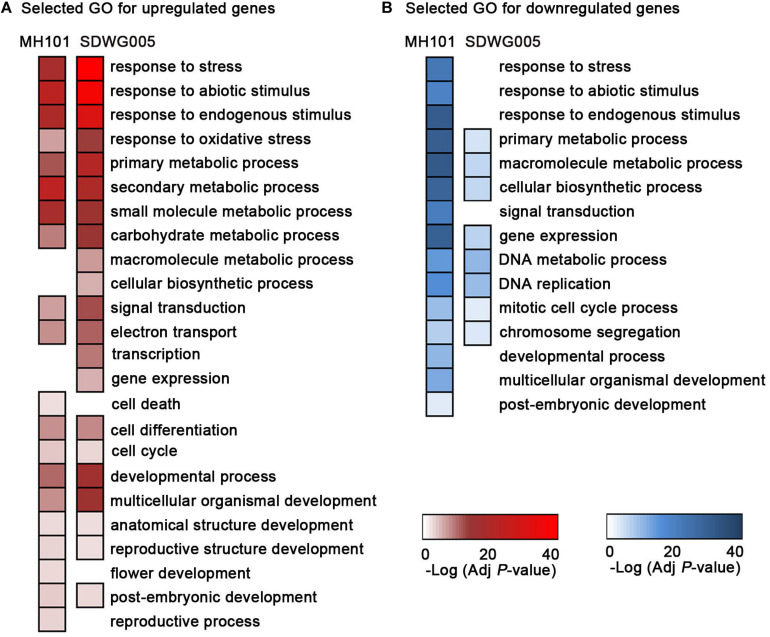
FIGURE 5.
GO enrichment analysis of DEGs for the biological process using AgriGO. Most representative enriched GO categories from the up-regulated DEGs (A) or down-regulated DEGs in rice spikelets upon heat stress (B), respectively. Color bars: -log10 transformed P-value (adjusted by Benjamini-Hochberg).

