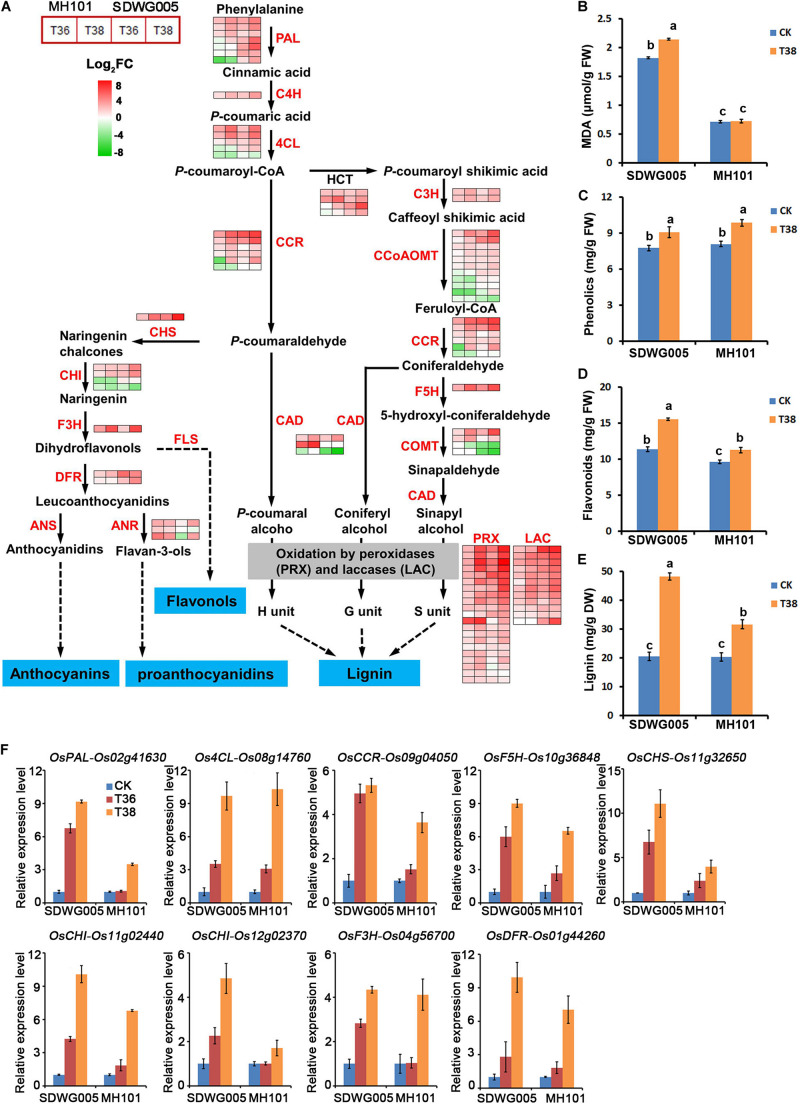
FIGURE 7.
Transcriptional changes of DEGs involved lignin and flavonoids biosynthetic pathways. (A) Expression heatmap of representative genes related to the lignin and flavonoids biosynthetic pathways. Data were log2 transformed and normalized to those of the corresponding normal growth controls to determine fold changes, as indicated by the colored bar. The detailed expression patterns and identities of the genes in each of these biosynthetic pathways are shown in Supplementary Table S6. Total content of MDA (B), phenolics (C), flavonoids (D), and lignin (E) in spikelets of SDWG005 and MH101 varieties under heat treatment for three days. (F) The relative expression levels of OsPAL, Os4CL, OsCCR, OsF5H, OsCHS, OsCHI, OsF3H, and OsDFR in spikelets of SDWG005 and MH101 were determined by qRT-PCR under T36 or T38 conditions for three days. The O. sativa β-tubline gene was used for normalization. Each value represents the mean of three independent observations and SD determined. Significant differences were calculated by One-way ANOVA with Duncan’s multiple test (SAS Institute, Inc., Cary, NC, United States). Different letters indicate the statistical difference between samples at P = 0.05.

