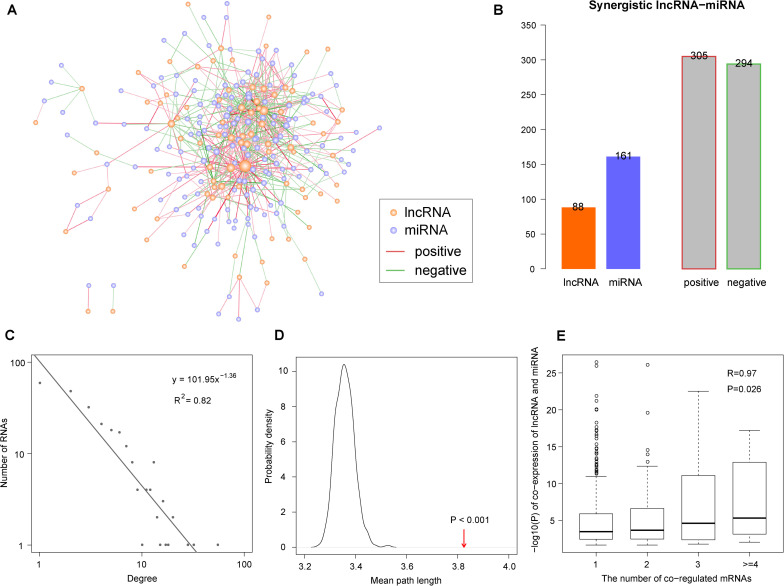
FIGURE 1.
The synergistic long non-coding RNAs (lncRNA)-microRNAs (miRNA) network in the context of colon adenocarcinoma (COAD). (A) Global view of the synergistic network. Orange and purple nodes represent lncRNAs and miRNAs, respectively. Red and green edges represent positive and negative synergistic relationships. Larger nodes represent higher degrees. (B) Statistics of nodes and edges in the synergistic network. (C) Degree distribution of the synergistic network. (D) The mean path length of the synergistic network is higher than randomization test. The arrow represents the mean path length in the real network. (E) The synergistic lncRNA–miRNA pairs with more co-regulated mRNAs show more significantly synergistic regulatory relationship. The white circles represents the outlier points in boxplots.

