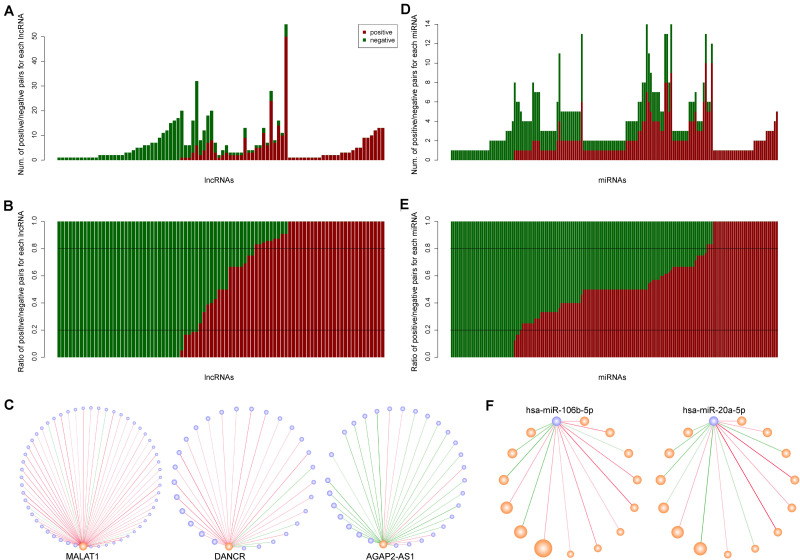
FIGURE 2.
The synergistic interactions between long non-coding RNAs (lncRNAs) and microRNAs (miRNAs). (A) The number of positive and negative miRNA neighbors for each lncRNA. Dark red and dark green represent positive and negative interactions, respectively. (B) The ratio of positive and negative miRNA neighbors for each lncRNA. (C) The synergistic interactions for three lncRNAs: MALAT1, DANCR, and AGAP2-AS1. (D) The number of positive and negative lncRNA neighbors for each miRNA. (E) The ratio of positive and negative lncRNA neighbors for each miRNA. (F) The synergistic interactions for two miRNAs: hsa-miR-106b-5p and hsa-miR-20a-5p.

