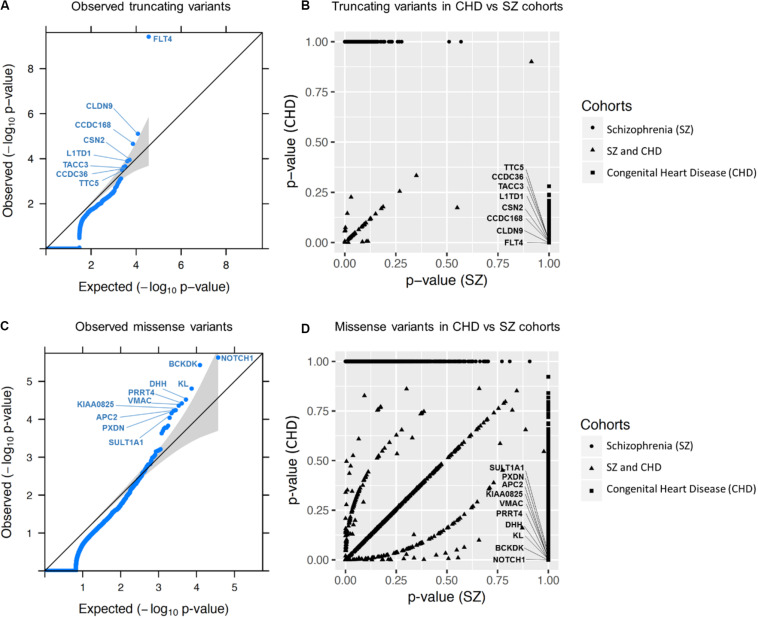
FIGURE 2.
Gene burden analysis results for all genes. (A,C) show the quantile-quantile (QQ) plots obtained for all ultra-rare truncating and missense variants in CHD, respectively (i.e., not setting any gene constraint cutoff). The QQ plots represent the scatter plots of the –log10 (p-value) expected under the null hypothesis of no genetic association versus the observed –log10 (p-value) for all 231 CHD samples. Gray shading indicates the 95% confidence interval. (B,D) represent scatter plots of gene burden p-values for truncating and missense variants, respectively, comparing the CHD and schizophrenia WGS data. Names of the top 8 and 10 genes identified for truncating (A) and missense (C) variants, respectively, are shown (results for top 6 of each are presented in Table 1); FLT4 (A) and NOTCH1 (C) were the most significant genes identified, neither with any observation in the comparison schizophrenia cohort (B,D). These plots were generated based on the genes without constraint on o/e score. Supplementary Figure S4 shows results for genes with constraint.

