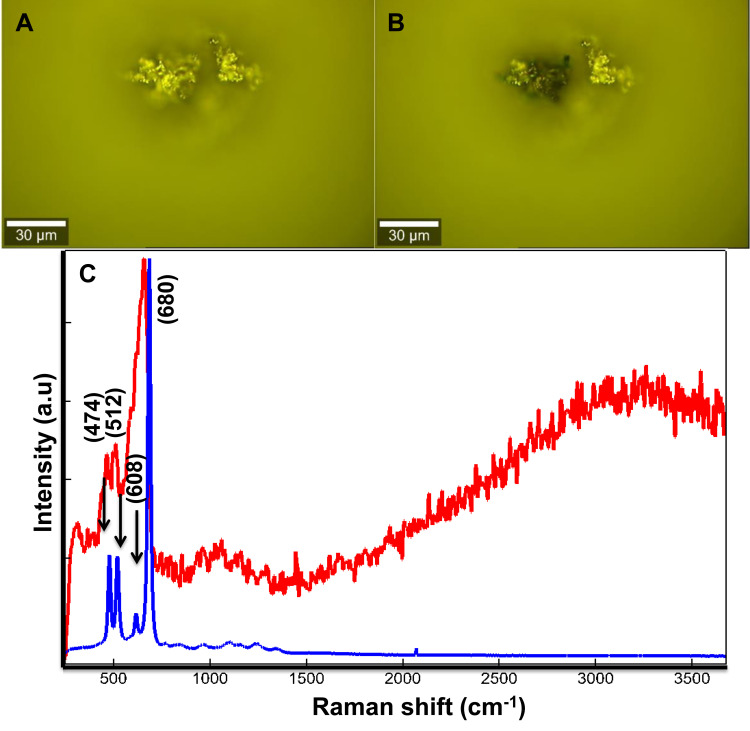
Figure 3.
Optical images of agglomerated Co MNPs studied by Raman spectroscopy with a laser power of (A) 5mW and (B) 20mW, (C) comparison of the Raman pattern obtained from Co MNPs powder with 532nm laser excitation under low power 5mW indicated by blue spectrum (A) to higher laser power 20mW indicated by red spectrum (B).

