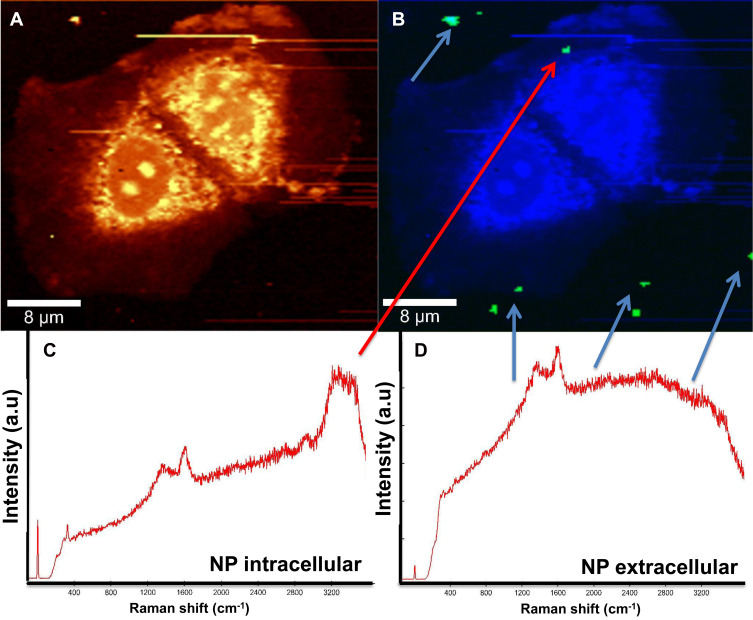
Figure 5.
MCF-7 cells incubated with Co nanoparticles, (A) integrated Raman intensities in the 2800–3000cm−1 region of cells, (B) Raman reconstruction of image A using KMCA to detect Co nanoparticles (green pixels indicated by arrows), (C) Raman spectrum of Co MNPs inside MCF7 cells (indicated by the red arrow), and (D) spectrum outside of the cells (blue arrows).

