Figure 1.
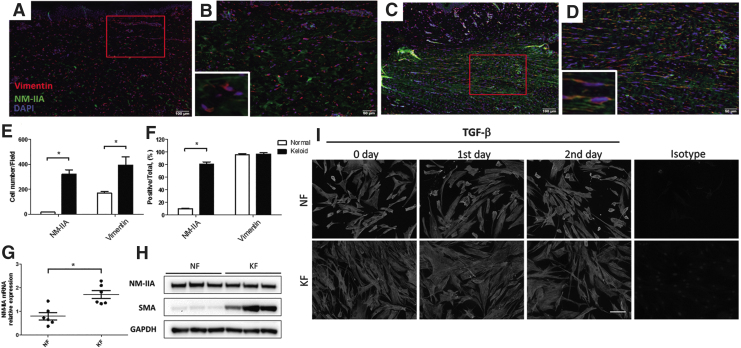
NM-IIA expression is increased in keloid tissue and keloid-derived fibroblasts. Five-micrometer paraffin sections of normal skin (n = 6) and keloids (n = 6) were deparaffinized and incubated with the following antibodies against NM-IIA and vimentin. NM-IIA (green) and vimentin (red) expression is shown in normal skin (A) and in keloid (C). High-power view of the skin showed colocalization of NM-IIA (green) and vimentin (red) in a normal skin (B) and in a keloid (D). Red rectangle in (A) and (C) indicates the enlarged area for high magnification in (B) and (D), respectively. The numbers of NM-IIA-expressing and vimentin-expressing cells were quantified from five randomly selected high-power fields (E). The percentage of NM-IIA-expressing or vimentin-expressing cells normalized to total cells (DAPI-stained cells) in the hypercellular areas was shown (F). (G) Real-time PCR analyses of NM-IIA in KFs and NFs. The expression levels are presented as scatter plots; the middle line represents the mean value (six NF and six KF, *p < 0.05). (H) Western blot showed the NM-IIA and SMA protein expression in NFs and KFs. The GAPDH levels were used as a loading control. (I) The fibroblasts were treated with TGF-β (20 ng/mL) at indicated times to examine the NM-IIA expression by immunofluorescence examination. The experiments were repeated for at least three times to reach consistency and each experiment was done in triplicates. KF, keloid fibroblast; NF, normal fibroblast; NM-IIA, nonmuscle myosin IIA; SMA, smooth muscle actin; TGF-β, transforming growth factor beta. Color images are available online.

