Figure 4.
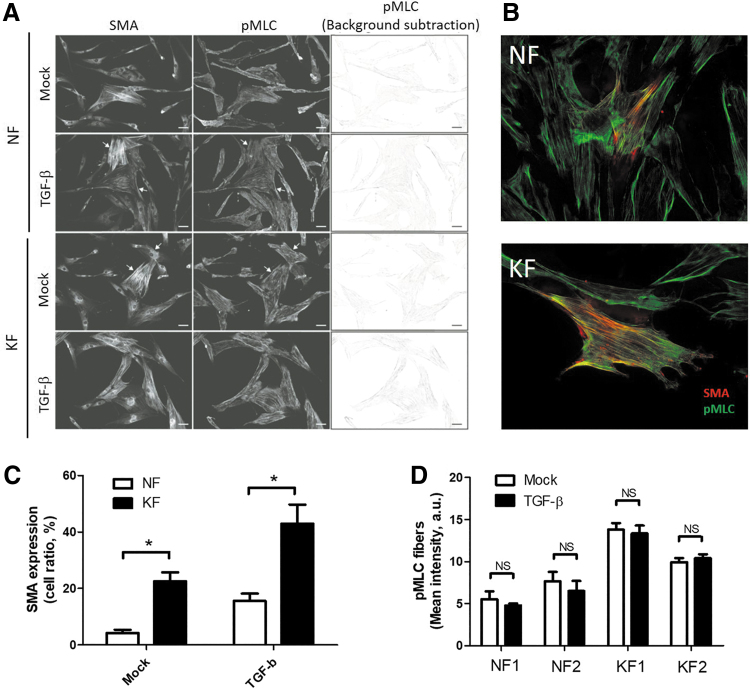
TGF-β effect on pMLC-mediated stress fibers. (A) Fluorescence images of KFs and NFs were taken in those stained with anti-SMA and anti-pMLC antibodies. Fibroblasts were treated with 20 ng/mL of TGF-β for 48 h. Right panels show the background-subtracted images of pMLC-mediated stress fibers. Arrows indicate the raw image showing the SMA- and pMLC-mediated stress fibers. Bar = 20 μm. (B) Fluorescence images of NFs and KFs were taken in those stained with anti-SMA antibody (Red) and anti-pMLC antibody. Bar = 20 μm. (C) The ratio of fibroblasts expressing SMA-mediated stress fibers was measured through images analysis in the left panel from (A) (n = 50–100 cells from three randomly selected fields, mean ± standard error of the mean, *p < 0.05, two-tailed t-test). (D) Quantification of the mean intensity of pMLC-mediated stress fibers was determined through analysis of staining images in the right panel of (A). The experiments were repeated for at least three times to reach consistency and each experiment was done in triplicates. pMLC, phosphorylation of myosin light chain. Color images are available online.

