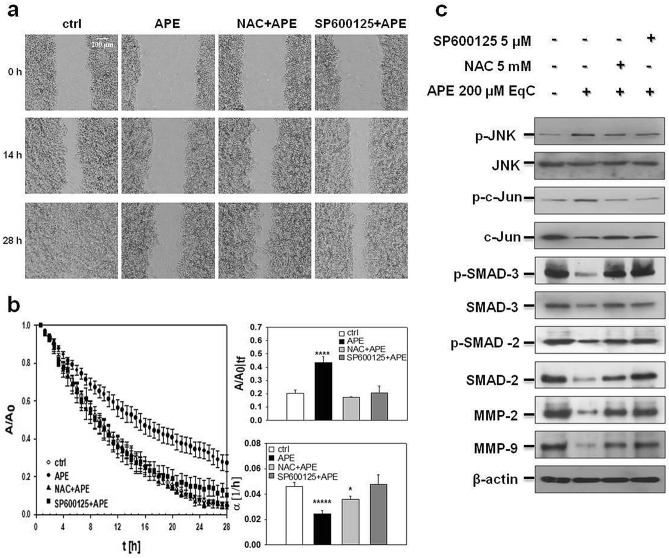
Figure 3.
APE inhibited MDA-MB-231 cell migration through ROS/JNK signaling activation. (a) Representative phase-contrast microscopy images showing the wound closure process at three different times in MDA-MB-231 cells incubated or not (ctrl) with APE 200 μM EqC with or without 1 h pretreatment with 5 mM NAC and/or 5 μM SP600125. Representative time lapse videos (videos S9–S12) are included in Supplementary Information. (b) Evolution over time of the wound area A, normalized to the value at time 0 (A0), for MDA-MB-231 cells incubated or not (ctrl) with APE with or without 1 h pretreatment with NAC and/or SP600125. The linear range of each data series was fit in order to measure the wound closure velocity α. Upper bar diagram shows the A/A0 values for treated cells at the time tf, when the A/A0 value for control is 0.2. Lower bar diagram shows the values of α (h-1) for control and treated cells at time tf. The values reported in the histograms represent the mean from several independent fields of view. Standard error of the mean was calculated and one-tailed and heteroscedastic t-test were computed to verify the statistical significance of the differences with respect to the control samples (*P < 0.05, ****P < 5 × 10⁻⁵, *****P < 5 × 10⁻⁶). (c) Cells were treated with 200 μM EqC APE for 48 h with or without 1 h pretreatment with 5 mM NAC and/or 5 μM SP600125. Cell lysates were prepared and analyzed by Western blot for the expression of p-JNK, JNK, p–c-Jun, c-Jun, p-SMAD-3, SMAD-3, p-SMAD-2, SMAD-2, MMP-2, and MMP-9. All results were obtained from at least three independent experiments. The full-length blots are included in Supplementary Information (Figs. S5, S6).

