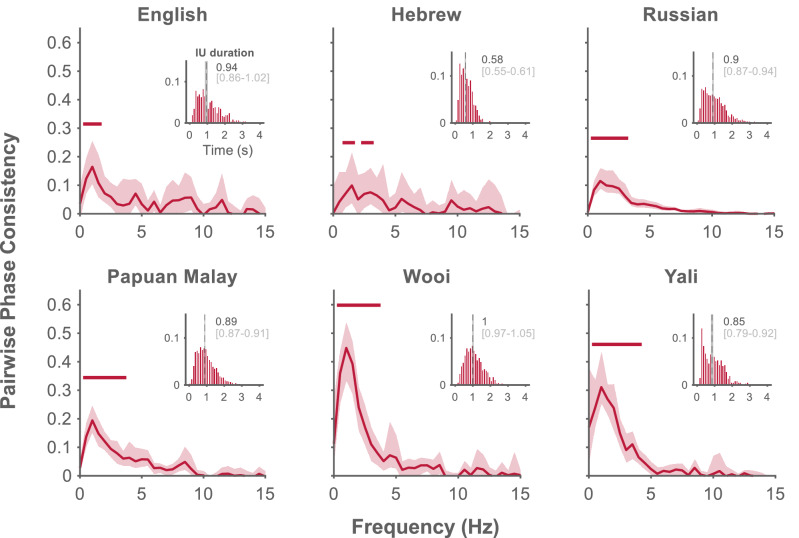
Figure 2.
Characterization of the temporal structure of Intonation Units. Phase-consistency analysis results include the average of phase consistency spectra across speakers for each language. Shaded regions denote bootstrapped 95% confidence intervals43 of the averages. Significance is denoted by a horizontal line above the spectra, after correction for multiple comparisons across neighboring frequency bins using an FDR procedure. Inset: Probability distribution of IU durations within each language corpus, calculated for 50 ms bins and pooled across speakers. Overlaid are the medians (dashed line; dark gray) and the bootstrapped 95% confidence intervals of the medians (light gray).

