Figure 4.
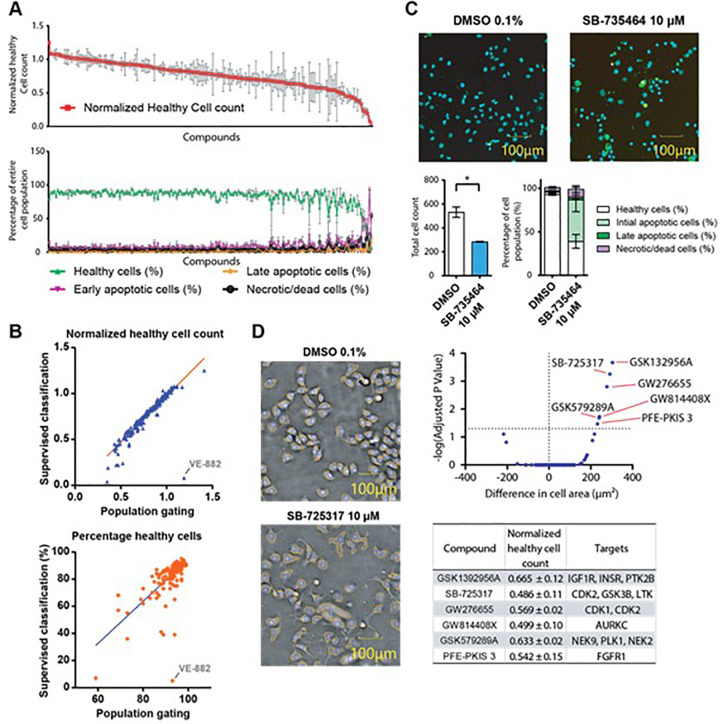
(A) Plotted healthy cell count normalized to the DMSO control and corresponding cellular fractions of PANC1 cells treated with the KCGS library at 10 µM for 24 h using the supervised classification method. (B) Comparison of the results of different gating mechanisms on selected inhibitors. Correlation of normalized healthy cell count (vs DMSO control) to the gated percentage of healthy cells of all tested 187 compounds of the both population gating and supervised classifications. Highlighted in both blots is the outlier VE-822. (C) Example of toxic compound, SB-735464, inducing apoptosis in PANC1 cells after 24 h with significantly reduced total cell count and increased apoptotic cell fractions. Student t test in prism with standard p values (*p < 0.05, **p < 0.01, *** p < 0.001, n = 3) using the supervised classification method. (D) Phase-contrast pictures of PANC1 cells incubated with DMSO or 10 µM SB-725317 for 24 h show enlarged cell bodies of the compound-treated cells (the detected cell body is depicted by the orange stroke). Volcano blot of difference in cell area of PANC1 cells of all compounds, with those that show a significant increase highlighted. These compounds were further analyzed with normalized cell count and annotated targets using the supervised classification method.

