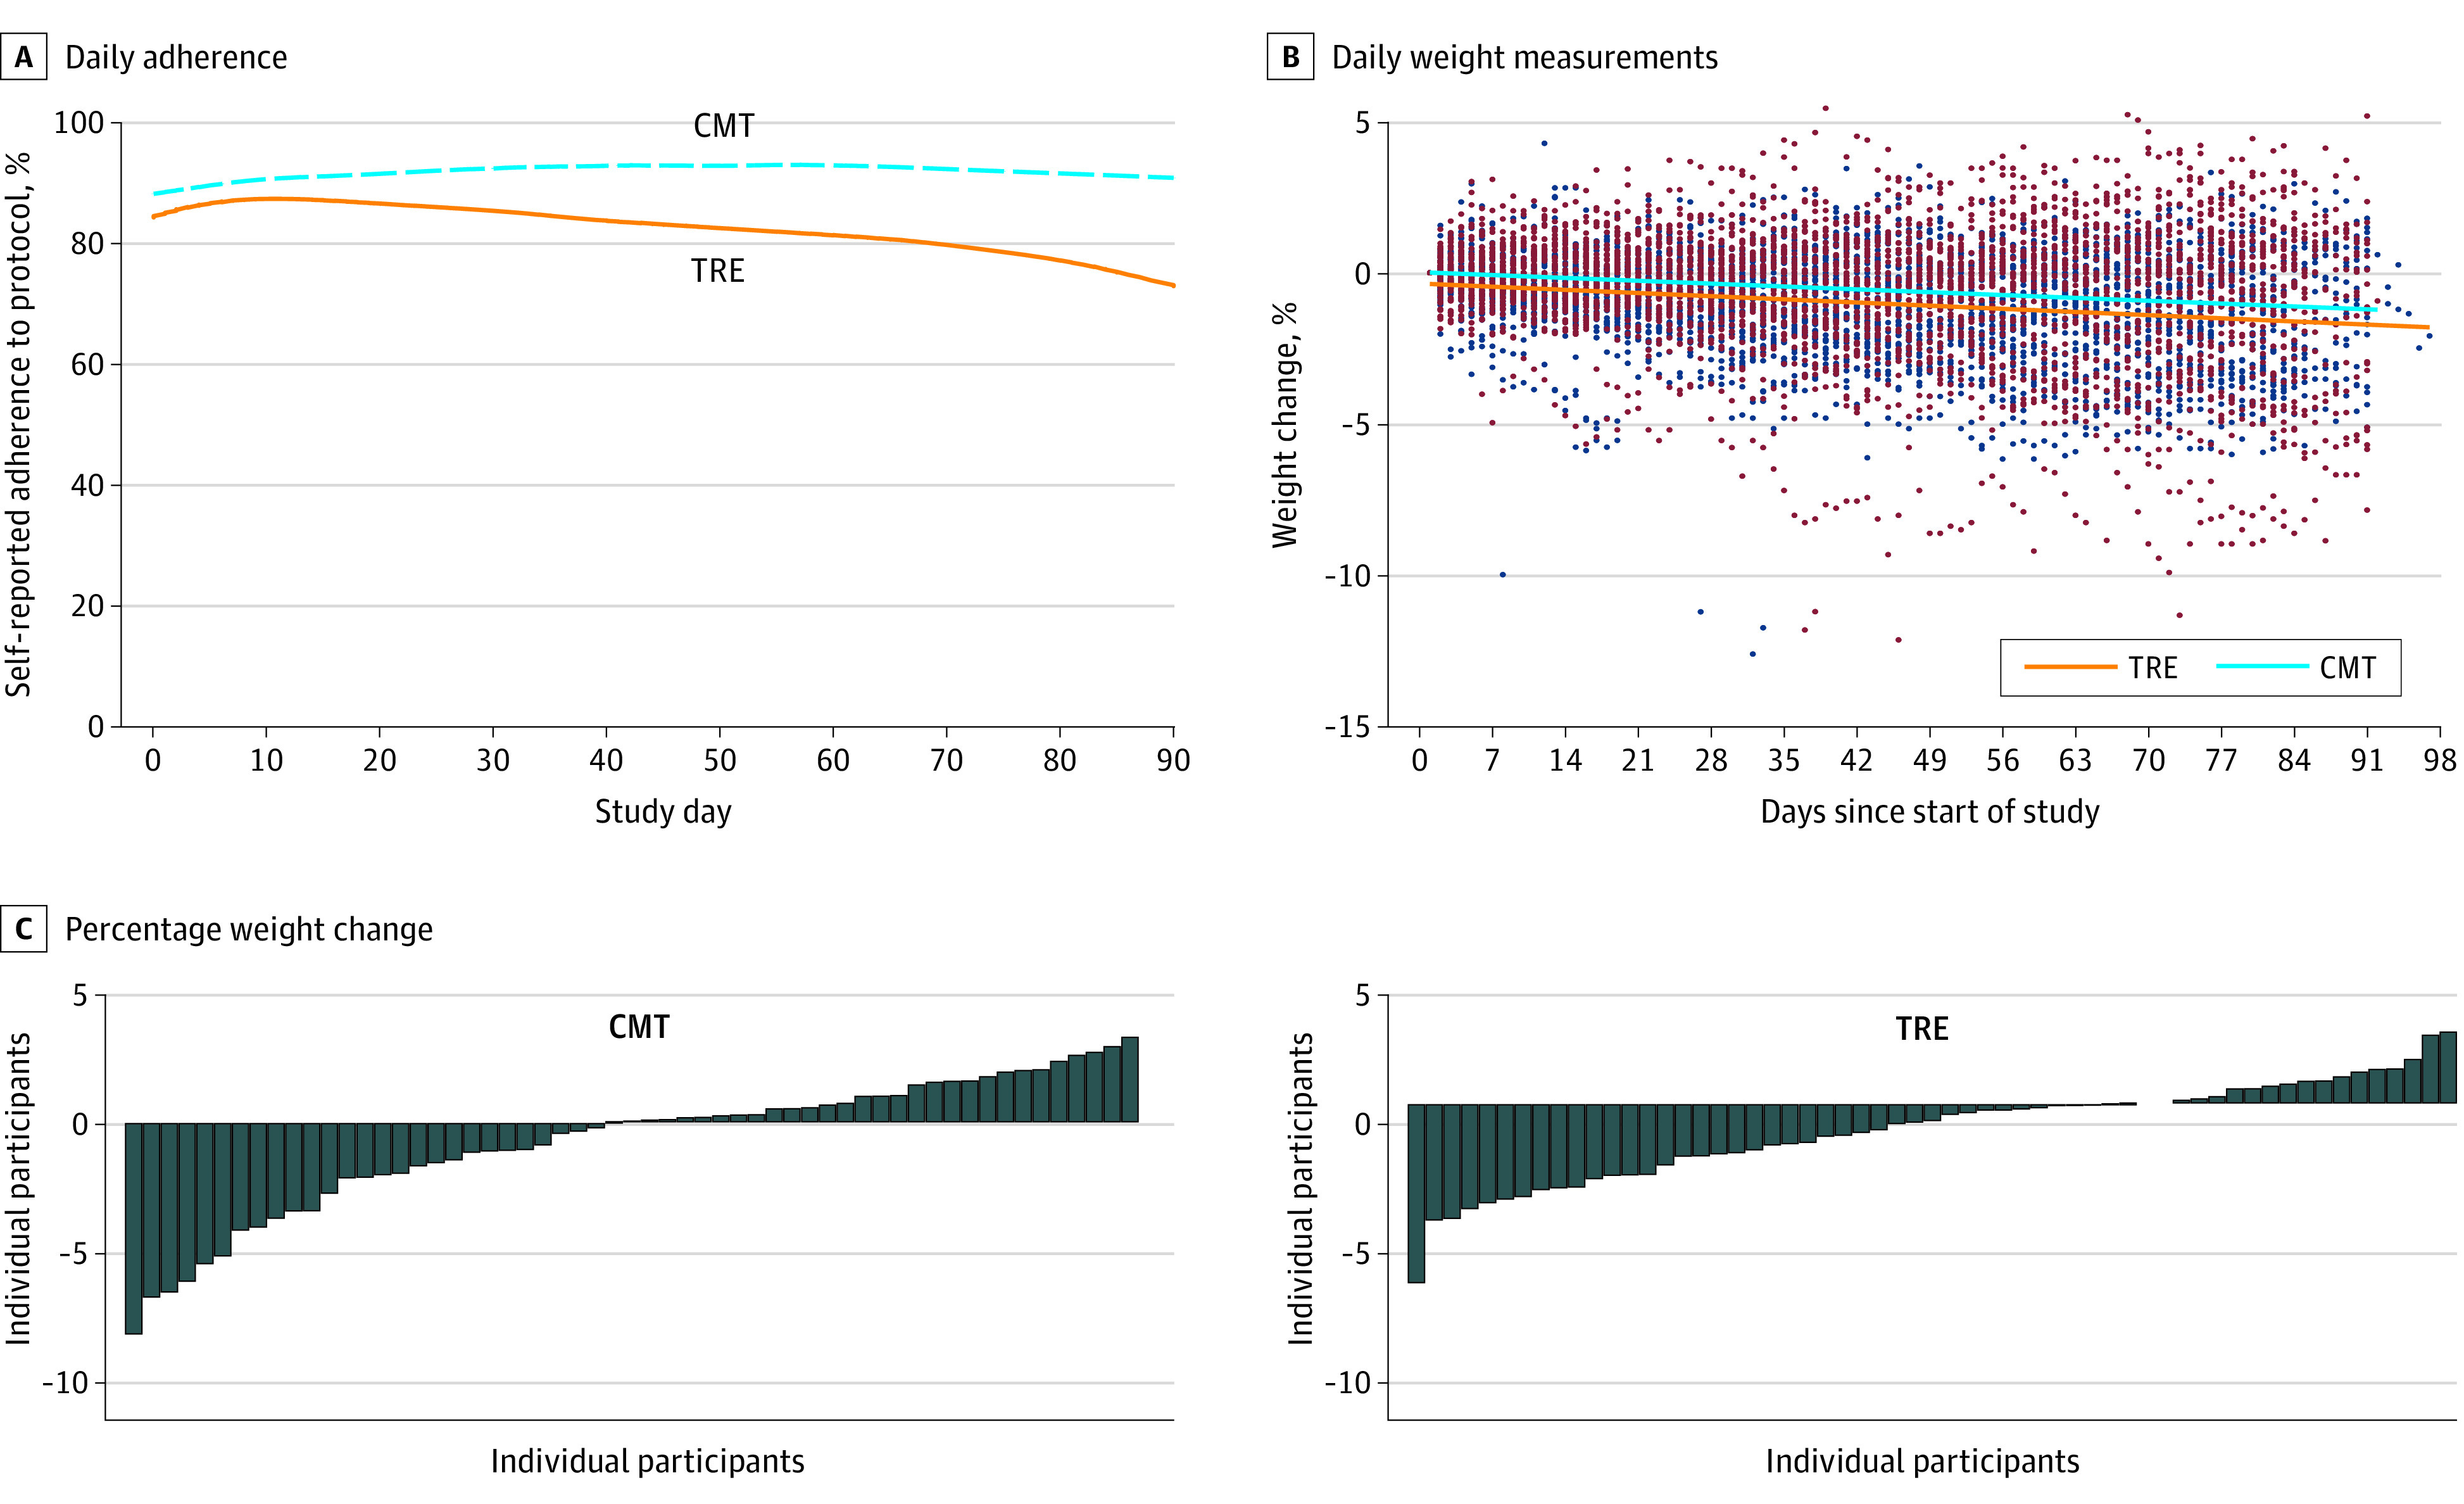
Figure 2. Adherence and Weight Change in the Total Cohort.

A, Participants were sent daily adherence surveys through the study application (“Did you adhere to your eating plan on the previous day?” Yes/No). Responses from all completed surveys were analyzed. The percent adherence to protocol is shown over time for consistent meal timing group (CMT) (dashed blue line; n = 41) and time-restricted eating (TRE) participants (solid orange line; n = 44). B, Individual daily weight measurements as recorded from the at-home scale are shown for each participant over time throughout the duration of the study. The individual weight measurements are show as maroon dots for the CMT group (n = 57) and blue dots for TRE group (n = 59). The solid lines represent weight over time as determined from the linear mixed model. C, Waterfall plot showing percent weight change for each participant from the total cohort in the CMT group (left) and TRE group (right).
