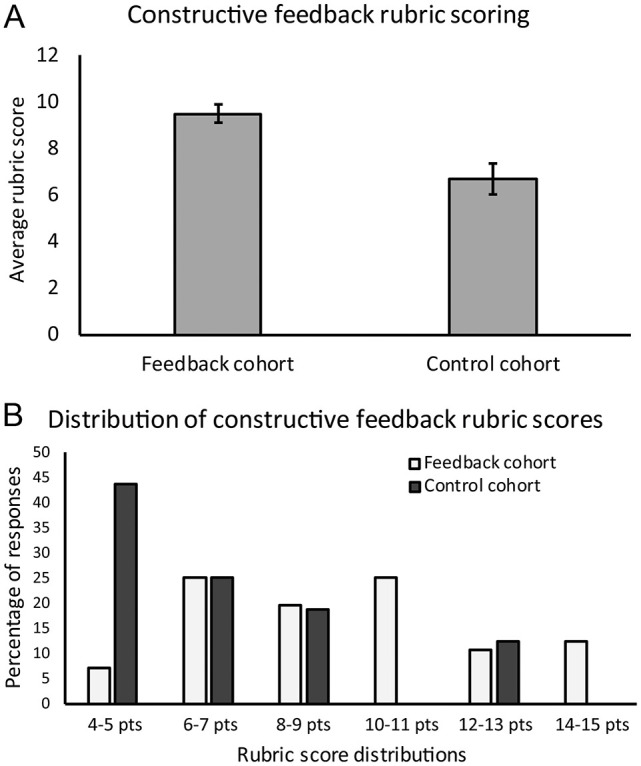
Figure 4.

Comparison of constructive feedback rubric scores between student cohorts: (A) open-response constructive feedback rubric scores (Table 2) between Feedback and Control cohorts from postcourse evaluations. P < .01. Errors bars, standard error of the mean. (B) Constructive feedback rubric score distribution of Feedback and Control cohorts.
