
Figure 1: Weighted cross-validated area under the receiver-operating curve (cv-AUC) for 42 candidate prediction algorithms fit on cases (n=150) and controls (n=7,466) in the development cohort - Atrius Health, 2007-2015.
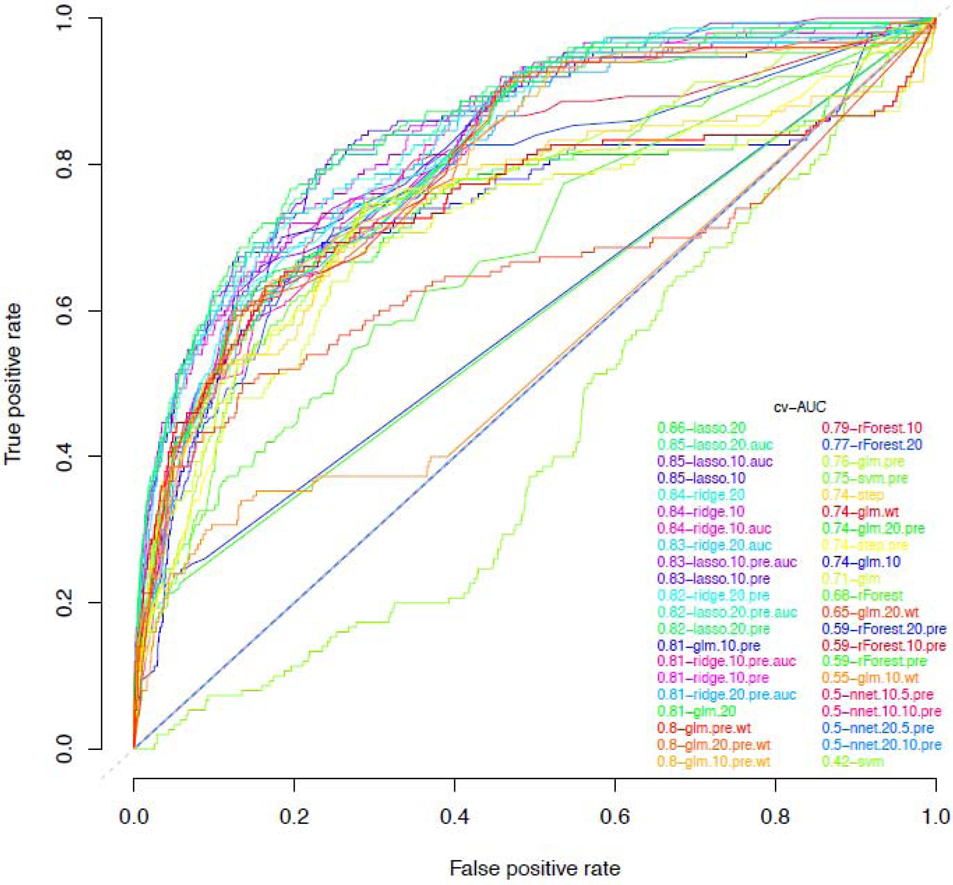
LASSO, least absolute shrinkage and selection operator; ridge, ridge regression; nnet, neural networks; glm, generalized linear model (logistic regression); step, logistic regression with stepwise backwards selection; rForest, random forest; svm, support vector machines. Algorithm abbreviations with “pre” denotes use of preselected covariates, with “auc” denotes AUC loss function instead of deviance loss, with “wt” denotes weighted regression, with “10” denotes undersampling with approximately 1:10 ratio of cases to controls, and with “20” denotes undersampling with approximately 1:20 ratio of cases to controls. For neural nets, the first number denotes the ratio of cases to controls, and the second number denotes the number of nodes in the network’s single hidden layer, e.g., 20·5 indicates a 1:20 case control ratio, with 5 nodes in the network’s hidden layer (appendix p 6).