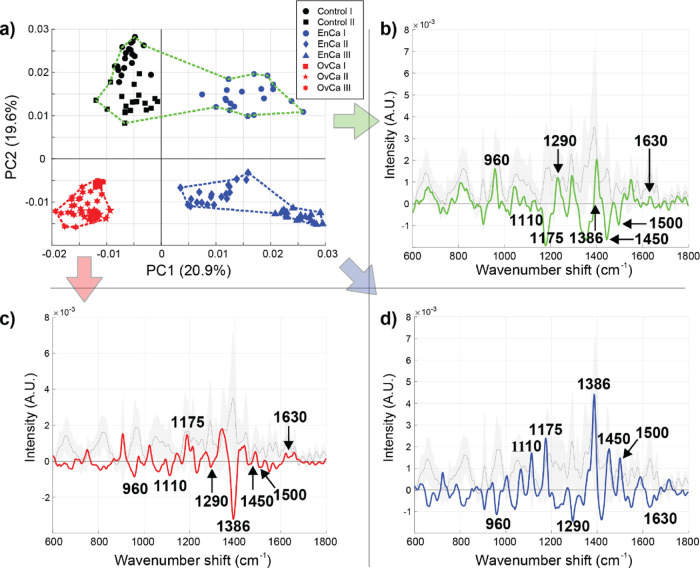
Figure 6.
SERS analysis of native EVs isolated from endometrial (EnCa) and ovarian cancer (OvCa) clinical samples. (a) The PCA score plot and (b–d) three cluster-specific spectra derived from hierarchical cluster analysis (blue, red, and green dotted lines – defined using the first five PCs). Given the separation of EVs isolated from clinical samples, it appears that PC1 reports the cancer type while PC2 informs the extent of cancer burden (the EnCa I patient, blue circles, was lower grade than the rest of the EnCa/OvCa samples).

