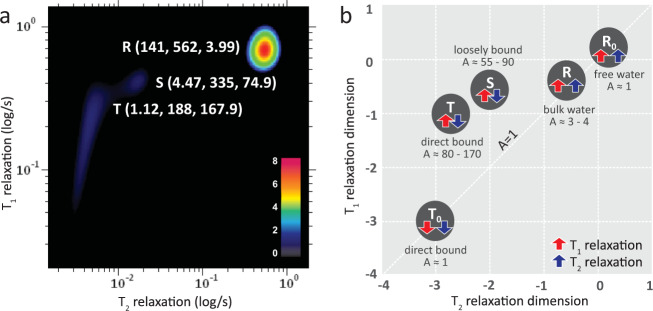
Fig. 3. The T1-T2 correlational spectrum of blood microenvironment.
a The decomposed relaxation reservoirs (R-peak, S-peak, and T-peak) of packed red blood cells microenvironment with the hemoglobin in oxygenated state. The coordinate is represented as (T2 relaxation (in ms), T1 relaxation (in ms), A-ratio (unitless)). A-ratio is the ratio between T1/T2. b The multiple relaxation reservoirs of the blood microenvironment in the T1-T2 correlational spectrum in log-log plot; i.e., the bulk water (R-peak), hydration layer (S-peak), and direct macromolecular protein interaction (T-peak) for hemoglobin in oxygenated state. In the oxidized state, the T-peak dropped substantially (T0-peak). The unbound molecule, Ro (e.g., free water) located on the diagonal line (A-ratio approaches unity).

